Measures of Variability
advertisement

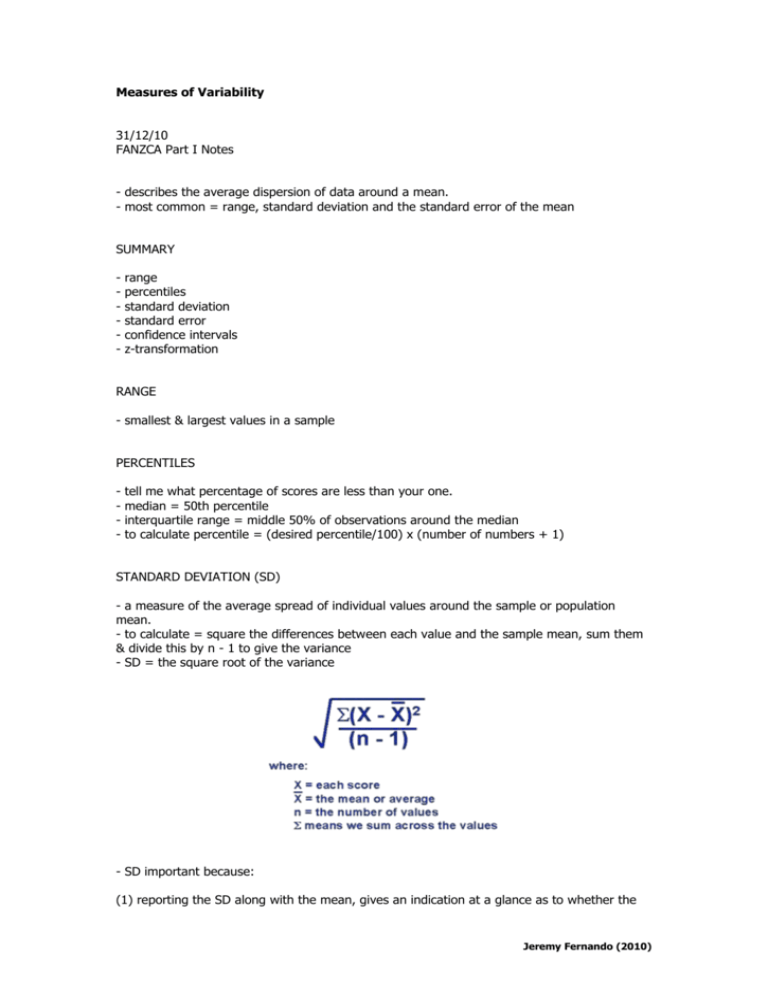
Measures of Variability 31/12/10 FANZCA Part I Notes - describes the average dispersion of data around a mean. - most common = range, standard deviation and the standard error of the mean SUMMARY - range percentiles standard deviation standard error confidence intervals z-transformation RANGE - smallest & largest values in a sample PERCENTILES - tell me what percentage of scores are less than your one. median = 50th percentile interquartile range = middle 50% of observations around the median to calculate percentile = (desired percentile/100) x (number of numbers + 1) STANDARD DEVIATION (SD) - a measure of the average spread of individual values around the sample or population mean. - to calculate = square the differences between each value and the sample mean, sum them & divide this by n - 1 to give the variance - SD = the square root of the variance - SD important because: (1) reporting the SD along with the mean, gives an indication at a glance as to whether the Jeremy Fernando (2010) sample mean represents a real trend in the sample. (2) if the sample is randomly selected sample & large -> it can be assumed to be close to that of the population. (3) the SD is used to calculate the standard error (see later) (4) any data point from a normal distribution can be described as a multiple of standard deviations from the population mean. - tables will then tell us the proportion of the distribution with values more extreme than that (z transformation) STANDARD ERROR = an estimate of the spread of sample means around the population mean. - it is estimated from the data in a single sample. - it is an estimated prediction based on the number in the sample and the sample sd. SE = SD / square root of n - thus, the variability among sample means will be increased if there is (a) a wide variability of individual data & (b) small samples. - SE used in parametric tests to quantify the difference between a sample mean & its proposed population mean -> how far the two are apart in multiples of the SE (ztransformation) - SE is used to calculate confidence intervals CONFIDENCE INTERVALS - is the range around a sample mean within which you predict the means of the sample's population lies. - the range in which you predict the 'true' value lies. Calculation - 95% of sample means should lie between 1.96 standard error of the mean above & below their sample mean. - thus, if the sample is large enough and is normally distributed as long as the sample was randomly selected then it should also represent the 95% CI for the population mean. - the population mean doesn't fall within this range -> there is a 95% chance that the samPle is from a different population. Information provided - an indication of the precision of the sample mean as an estimate of the population mean - the wider the CI -> the greater the imprecision -> the greater the potential difference between the calculated sample mean & 'true' mean. Causes of wide CI's Jeremy Fernando (2010) - small sample - large variance within samples CI vs P value - p gives a probability of a specific hypothesis being right or wrong - CI's allow more scope for reader judgement on significance. Jeremy Fernando (2010)


