Cricket Chirp Lab: Scientific Method Worksheet
advertisement
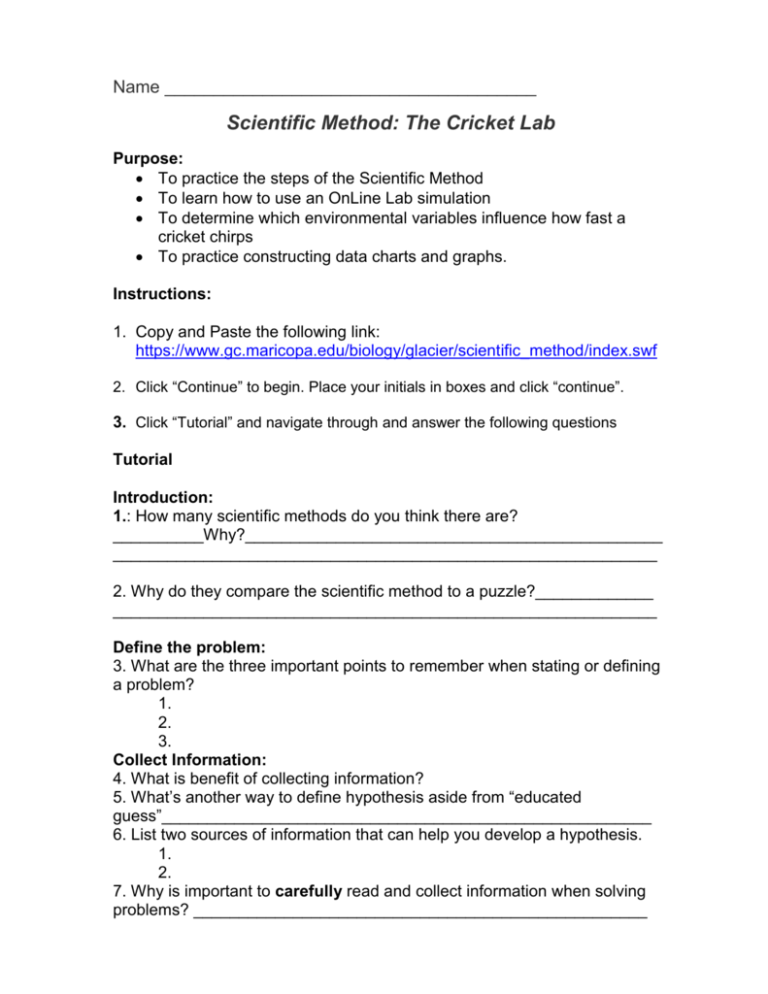
Name ______________________________________ Scientific Method: The Cricket Lab Purpose: To practice the steps of the Scientific Method To learn how to use an OnLine Lab simulation To determine which environmental variables influence how fast a cricket chirps To practice constructing data charts and graphs. Instructions: 1. Copy and Paste the following link: https://www.gc.maricopa.edu/biology/glacier/scientific_method/index.swf 2. Click “Continue” to begin. Place your initials in boxes and click “continue”. 3. Click “Tutorial” and navigate through and answer the following questions Tutorial Introduction: 1.: How many scientific methods do you think there are? __________Why?______________________________________________ ____________________________________________________________ 2. Why do they compare the scientific method to a puzzle?_____________ ____________________________________________________________ Define the problem: 3. What are the three important points to remember when stating or defining a problem? 1. 2. 3. Collect Information: 4. What is benefit of collecting information? 5. What’s another way to define hypothesis aside from “educated guess”______________________________________________________ 6. List two sources of information that can help you develop a hypothesis. 1. 2. 7. Why is important to carefully read and collect information when solving problems? __________________________________________________ After completing the “Collect Information” click on “Test the Hypothesis” on the left hand side. ( Skipping formulate a hypothesis) Test a Hypothesis 8. What was the problem with Michael’s Experiment? __________________ ____________________________________________________________ 9. Why is it important to only have one independent variable? __________ ____________________________________________________________ 10. Which of the conditions do we know varied in Michael’s experiment? ____________________________________________________________ 11. Why is impossible to determine is the effect of music on the flower growth? _____________________________________________________ ____________________________________________________________ 12. What are controlled factors? __________________________________ ____________________________________________________________ *Michael’s Plant growth experiment concludes our tutorial. Move to the “Cricket Experiment” and complete the following: Procedure: 1. Define the problem: _______________________________________________________________ _______________________________________________________________ 2. Follow the instructions for investigating the role of environmental variables on cricket chirps. 3. Each group will be assigned a variable by your teacher. Hypothesis: Cricket chirps are affected by _____________________________________ 4. Write your results in the data charts below 5. For your investigation, choose values that are higher and lower than those indicated below. You may add rows to the data chart as needed. You need to record as you go because this Online site does not work well if you use the back button! 6. Graph your results using white paper and a ruler. a. The independent variable ______________________________________ b. The dependent variable _______________________________________ 7. Make a conclusion about YOUR experiment. 8. When everyone is finished you will share your data with the class. 9. As a class you will come up with one conclusion. Results: (Data Charts and Graphs): Note: You will need to construct more rows for these data charts! Data Chart A: Effect of Temperature on Crick Chirps Temperature Cricket Chirp Rate (oC) (chirps/minute) 25 148 Data Chart B: Effect of Atmospheric Pressure on Crick Chirps Atmospheric Pressure Cricket Chirp Rate (mm Hg) (chirps/minute) 760 148 Data Chart C: Effect of Humidity on Crick Chirps Humidity Cricket Chirp Rate (%) (chirps/minute) 15 148 Data Chart D: Effect of Wind Speed on Crick Chirps Wind Speed Cricket Chirp Rate (m/sec) (chirps/minute) 2 148 Please make your graph on a separate piece of white paper and attach AFTER Printing Assignment: Conclusions and Analysis (Answer in FULL sentences—typed you may type the answer directly under the question—then print entire activity, attach graph and hand in). 1. What is the importance of sharing information between scientists? 2. After reviewing the classes data on different variables make a conclusion using the CLASS data. 3. How did the other group’s information effect your overall conclusion about crickets? 4. Why was it important to that you “tested” the cricket 10 times? How does getting an AVERAGE benefit the way you evaluated the information?
