Estimating Abundance – Closed Population Mark and Recapture
advertisement
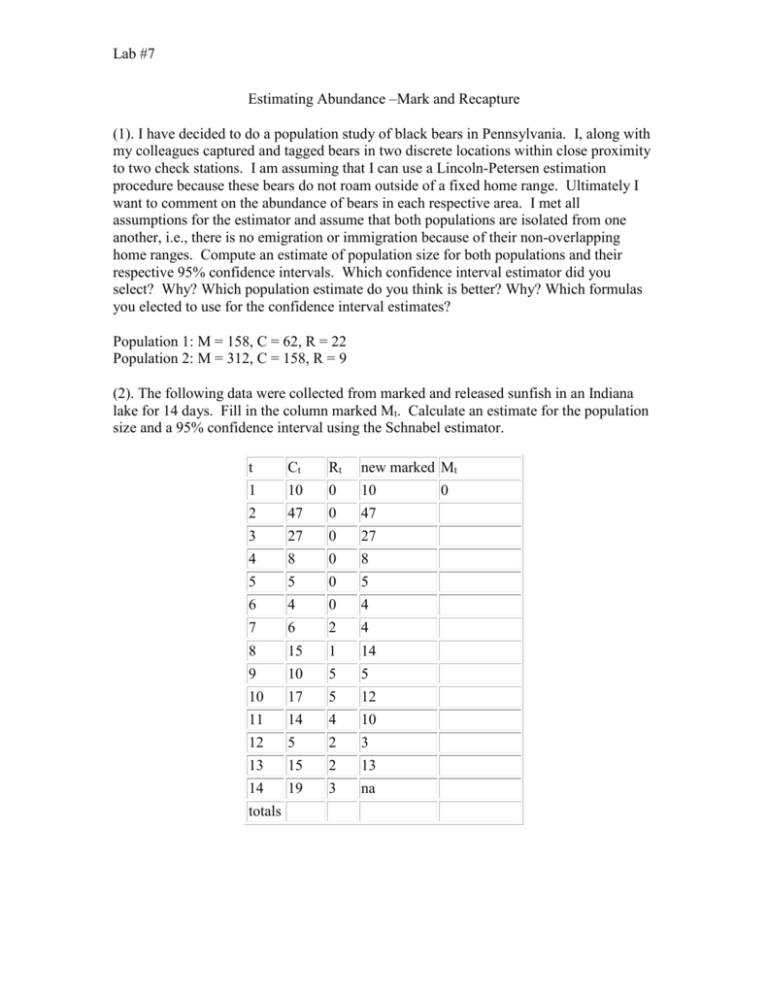
Lab #7 Estimating Abundance –Mark and Recapture (1). I have decided to do a population study of black bears in Pennsylvania. I, along with my colleagues captured and tagged bears in two discrete locations within close proximity to two check stations. I am assuming that I can use a Lincoln-Petersen estimation procedure because these bears do not roam outside of a fixed home range. Ultimately I want to comment on the abundance of bears in each respective area. I met all assumptions for the estimator and assume that both populations are isolated from one another, i.e., there is no emigration or immigration because of their non-overlapping home ranges. Compute an estimate of population size for both populations and their respective 95% confidence intervals. Which confidence interval estimator did you select? Why? Which population estimate do you think is better? Why? Which formulas you elected to use for the confidence interval estimates? Population 1: M = 158, C = 62, R = 22 Population 2: M = 312, C = 158, R = 9 (2). The following data were collected from marked and released sunfish in an Indiana lake for 14 days. Fill in the column marked Mt. Calculate an estimate for the population size and a 95% confidence interval using the Schnabel estimator. t Ct Rt new marked Mt 1 10 0 10 2 47 0 47 3 27 0 27 4 8 0 8 5 5 0 5 6 4 0 4 7 6 2 4 8 15 1 14 9 10 5 5 10 17 5 12 11 14 4 10 12 5 2 3 13 15 2 13 14 19 3 na totals 0 Lab #7 (3). What are the assumptions of the Lincoln-Petersen and Schnabel population estimators? Describe three situations in wildlife or fisheries where you might be able to use either of these estimators. Explain how you would satisfy each assumption in each situation. (4). The following Method B table was computed by Leslie et al. (1953) for field voles in Wales. Remember that for sample 1 you will have no population estimate and for the last sample, you will have no estimate for the size of the marked population or the population size. Leslie, P.H., D. Chitty, and H. Chitty. 1953. The estimation of population parameters from data obtained by means of capture-recapture method III. An example of the practical application of the method. Biometrika 40:137-169. mt = number of marked animals caught in sample t ut = number unmarked animals caught in sample t nt = number of animals caught in sample t, mt + ut st = number of animals released after sample t (nt - # of accidental deaths) mrt = number of marked animals caught in sample t, last caught in sample r Rt = number of the st individuals released at sample t and caught again in a later sample Zt = number of individuals marked before sample t, not caught in sample t, but caught in some sample after t. Lab #7 1. Estimate the population size at time interval. To estimate the population size, use the following equations: A. Proportion of animals marked at time t. B. The number of marked animals in the population. C. The population estimate (FILL IN THE TABLE – I GOT YOU STARTED). 2. Estimate the survival rate at each interval. 3. Estimate the dilution rate at each interval. (Add a column to your table) Time of capture, t 1 2 3 4 5 6 7 8 9 10 11 12 13 mt 0 12 17 23 20 28 57 49 57 44 62 82 19 st 96 41 82 64 64 104 121 89 92 95 127 188 25 nt 107 45 85 69 67 106 125 99 117 98 127 190 26 Rt Zt alphat Mt Nt Φt 25 0 N/A N/A N/A 11 13 34 7 na na na na λt na 4. Plot your results for Nt against time and plot Φt against λt. What do these graphs tell you? 5. Based on your findings in the above table, what can you conclude about this population of field voles? 6. What are the assumptions of the Jolly-Seber population estimation procedure?


