Forecast of the Black Sea state in the Georgian coastal zone
advertisement
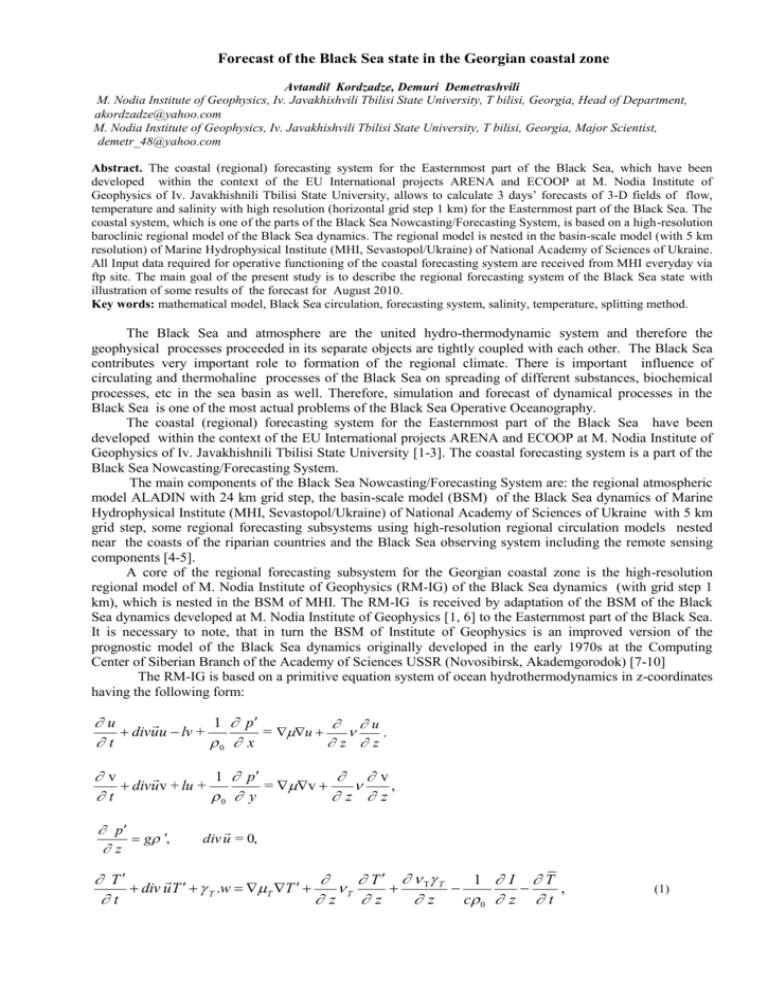
Forecast of the Black Sea state in the Georgian coastal zone Avtandil Kordzadze, Demuri Demetrashvili M. Nodia Institute of Geophysics, Iv. Javakhishvili Tbilisi State University, T bilisi, Georgia, Head of Department, akordzadze@yahoo.com M. Nodia Institute of Geophysics, Iv. Javakhishvili Tbilisi State University, T bilisi, Georgia, Major Scientist, demetr_48@yahoo.com Abstract. The coastal (regional) forecasting system for the Easternmost part of the Black Sea, which have been developed within the context of the EU International projects ARENA and ECOOP at M. Nodia Institute of Geophysics of Iv. Javakhishnili Tbilisi State University, allows to calculate 3 days’ forecasts of 3-D fields of flow, temperature and salinity with high resolution (horizontal grid step 1 km) for the Easternmost part of the Black Sea. The coastal system, which is one of the parts of the Black Sea Nowcasting/Forecasting System, is based on a high-resolution baroclinic regional model of the Black Sea dynamics. The regional model is nested in the basin-scale model (with 5 km resolution) of Marine Hydrophysical Institute (MHI, Sevastopol/Ukraine) of National Academy of Sciences of Ukraine. All Input data required for operative functioning of the coastal forecasting system are received from MHI everyday via ftp site. The main goal of the present study is to describe the regional forecasting system of the Black Sea state with illustration of some results of the forecast for August 2010. Key words: mathematical model, Black Sea circulation, forecasting system, salinity, temperature, splitting method. The Black Sea and atmosphere are the united hydro-thermodynamic system and therefore the geophysical processes proceeded in its separate objects are tightly coupled with each other. The Black Sea contributes very important role to formation of the regional climate. There is important influence of circulating and thermohaline processes of the Black Sea on spreading of different substances, biochemical processes, etc in the sea basin as well. Therefore, simulation and forecast of dynamical processes in the Black Sea is one of the most actual problems of the Black Sea Operative Oceanography. The coastal (regional) forecasting system for the Easternmost part of the Black Sea have been developed within the context of the EU International projects ARENA and ECOOP at M. Nodia Institute of Geophysics of Iv. Javakhishnili Tbilisi State University [1-3]. The coastal forecasting system is a part of the Black Sea Nowcasting/Forecasting System. The main components of the Black Sea Nowcasting/Forecasting System are: the regional atmospheric model ALADIN with 24 km grid step, the basin-scale model (BSM) of the Black Sea dynamics of Marine Hydrophysical Institute (MHI, Sevastopol/Ukraine) of National Academy of Sciences of Ukraine with 5 km grid step, some regional forecasting subsystems using high-resolution regional circulation models nested near the coasts of the riparian countries and the Black Sea observing system including the remote sensing components [4-5]. A core of the regional forecasting subsystem for the Georgian coastal zone is the high-resolution regional model of M. Nodia Institute of Geophysics (RM-IG) of the Black Sea dynamics (with grid step 1 km), which is nested in the BSM of MHI. The RM-IG is received by adaptation of the BSM of the Black Sea dynamics developed at M. Nodia Institute of Geophysics [1, 6] to the Easternmost part of the Black Sea. It is necessary to note, that in turn the BSM of Institute of Geophysics is an improved version of the prognostic model of the Black Sea dynamics originally developed in the early 1970s at the Computing Center of Siberian Branch of the Academy of Sciences USSR (Novosibirsk, Akademgorodok) [7-10] The RM-IG is based on a primitive equation system of ocean hydrothermodynamics in z-coordinates having the following form: u 1 p u divu u lv + = u z z t 0 x , v 1 p v divu v + lu + = v , t 0 y z z p g , z div u = 0, T T T T 1 I T div uT T .w T T T , t z z z c 0 z t (1) S S S S S div uS + S w = S S S , t z z z t = T T + S S , T T , z S S , z T T ( z, t ) T , S S ( z, t ) S , = ( z, t ) , p p( z, t ) p , = , x x y y I 0 a sinh 0 b sinh 0 , I R0 e z , R0 = (1 A) I 0 , sinh 0 sin sin cos cos cos 12 ~ t , 1 (a~ b n~ )n~ . T f / T 10 3 (0.0035 0.00938T 0.0025S ), S f / s 10 3.(0.802 0.002T ) . Here u, v, and w are the components of the current velocity vector u along the axes x, y, and z, respectively (the axes x, y, and z are directed eastward, northward and vertically downward from the sea surface, respectively); T , S , P , are the deviations of temperature, salinity, pressure and density from their standard vertical distributions T , S , P , ; l l 0 . y is the Coriolis parameter, where dl / dy ; g , c and 0 are the gravitational acceleration, the specific heat capacity and average density of seawater; , T ,S , , T ,S are the horizontal and vertical eddy viscosity, heat and salt diffusion coefficients, respectively; I 0 is the total solar radiation flux at z 0 determined by the Albrecht formula, A is the albedo of the sea surface, h0 is the zenithal angle of the Sun; is the geographical latitude, is the parameter of declination of the Sun, is the factor which takes into account influence of cloudiness on total radiation and depends upon ball of ~ cloudiness n~ ; a, b, a~, b are the empirical factors; is the parameter of absorption of short-wave radiation by seawater. System of equations (1) is subject to the following boundary and initial conditions: zy v , z 0 u zx , z 0 T = T * T (0, t ) S = S* S (0, t ) or T or T Q T R0 z S if z = 0, S ( PR EV ) S 0 , z u 0 , v = 0 , w = 0, T/ z T , S/ z S on z H ( x, y ) , u 0, v = 0, T/ n 0 , S/ n 0 at Г0 , ~ ~ u u~ , v = ~ v , T = T , S = S at Г1 , u u 0 , v = v 0 , T = T0 , S = S0 if t = 0, (2) (3) where H describes the relief of the sea bottom; zx , zy , T , S are the wind stress components along the axes * * x and y, temperature and salinity at the sea surface (z = 0), respectively; QT QT / c , where QT is the turbulent heat flux in the atmosphere; R 0 R0 / c ; Г0 is the lateral surface adjacent to the land, and Г1 is the ~ ~ u , ~v , T , S are liquid boundary separating the regional water area from the open part of the Black Sea. ~ the current velocity components along the axes x and y and the deviations of temperature and velocity at the liquid boundary, respectively (they are prognostic values predicted by the BSM of MHI). PR and EV are the atmospheric precipitation and evaporation. Like prior articles [1-3, 6], the coefficients of horizontal turbulent viscosity and diffusion for heat and salt were calculated by formula given in [11] and the coefficients of vertical turbulent diffusion - by formula presented in [12]. Vertical turbulent viscosity factor 2 50cm / s , z 55m 2 10cm / s , z 55m In case of unstable stratification, which might appear during integration of the equations ( 0 ), z the realization of this instability in the model is taken into account by increase of heat and salt diffusion factors T ,S 20 times in appropriate columns from surface to a bottom. To solve the problem (1)-(3) we used the two-cycle method of splitting the model equation system with respect to both physical processes and coordinate planes and lines, which was proposed to solve problems of ocean and atmosphere dynamics by Marchuk [13]. The finite-difference schemes received at each elementary stage of splitting are absolutely steady, energetically balanced and provide the second order accuracy on time and space coordinates (in case of uniform grid). To use the splitting method substantially simplifies the implementation of complex physical model and enables us to reduce solution of 3-D nonstationary problem to solution of more simple 2-D and 1D problems. The domain of solution, which is bounded with the Caucasus and Turkish shorelines and the western liquid boundary coincident with 39.360E, was covered with a grid 193 x 347 having horizontal resolution 1 km. On a vertical the non-uniform grid with 30 calculated levels on depths: 2, 4, 6, 8, 12, 16, 26, 36, 56, 86, 136, 206, 306, …, 2006 m were considered. The time step was equal to 0.5 h. The parameter of radiation absorption was accepted as equal to 0.0023m 1 , which corresponds to usual ocean water, where about 10% of radiation reaches depth of 10 m. Empirical factors accepted values: 1.54kW / m 2 , ~ b 0.22kW / m 2 , ~ a b 0.38 . Specific heat capacity c 4.09Jg 1 K 1 , which corresponds to a seawater with salinity 18%. The other parameters had the following values: g = 980 cm/s 2, 0 1g / cm 3 , l 0 0.95 10 4 s 1 , 10 13 cm 1s 1 , To demonstrate the operation of the regional forecasting subsystem, there is considered one example of the forecast corresponding to the forecasting time period from 00:00 h, 6 August to 00:00 h, 9 August 2010 (here and after local time is used). The surface current fields after 24 and 72 hours (time is counted from the initial moment of the forecast, 00:00 h, 6.08.2010), predicted by the RM-IG, are presented in Fig.1 and the same fields predicted by the BSM of MHI at the same time moments are shown in Fig. 2. From these Figures are clear that the main element of the regional circulation is the anticyclonic eddy (called the Batumi eddy) with diameter about of 150-200 km, which covers the significant part of the considered area. The comparative analysis of Figs. 1 and 2 shows that the results of forecast of the Batumi eddy predicted by both models are practically the same. According to both models this eddy is rather stable formation and it is observed during all forecasting period without significant changes, despite nonstationarity of atmospheric forcing. It must be noted that formation of the anticyclonic eddy in the south-east part of the Black Sea basin and its stability in Summer season is a well-known fact [14, 15]. The analysis of the current patterns on the lower horizons predicted from the RM-IG showed that the Batumi eddy did not change qualitatively in the upper 200 m layer, only current speed decreased from maximal value equal to 34 cm/s till 12 cm/s. Bellow 200 m it gradually decreased in sizes and on the depth of 1000 m it practically did not observe. Results of other numerical experiments showed that, the above features of vertical structure of the Batumi eddy are general and take place during other time period too. Sea circulation patterns predicted by both RM-IG and BSM of MHI considerably differ from each other in the narrow zone with width about 20-25 km along the Caucasian shoreline. The system of currents in this zone by results of RM-IG is characterized by the clear tendency to vortex formation of very small sizes and nonstationarity, whereas results of BSM specify about smoothness and practically non-stationary character of current in this zone. In the water area near Sukhumi the eddy of small sizes is formed (Fig. 1) on results of the RM-IG, which does not observe on results of the BSM of MHI. The existence of rather unstable eddies of small sizes of cyclonic and anticyclonic characters near the Georgian shoreline is known from observations, but their identification by the mathematical models is possible by providing very high resolution , that is achieved in the RM-IG. (a) t = 24 h (b) t = 72 h Fig.1. The surface current fields predicted by RM-IG at 24 h (a) and 72 h (b). (a) t = 24 h (b) t = 72 h Fig. 2. The surface current fields predicted by BSM of MHI at 24 h (a) and 72 h (b). Some differences between thermohaline fields predicted by the RM-IG and BSM of MHI are observed too. Figs. 3 and 4, where salinity fields predicted by both models after 24 and 72 hours are shown on depth of 10 m, clearly demonstrate these differences: From Fig.3 it is well visible that waters with relatively high salinity are penetrating through the open boundary from the central part of the Black Sea to the Georgian coastal area in a form of the narrow strip around the periphery of the Batumi eddy, whereas the coarse resolution model is practically unable to reproduce this phenomenon (Fig. 4). According to both RM-IG and BSM the zone of relatively lower salinity is in the central part of the Batumi eddy. This low salinity zone is providing by descending currents developed in the anticyclonic eddy transporting less salty waters from the upper layers downwards. Hereby, there is clear that intensification of the Batumi anticyclonic eddy in summer season brings the considerable contribution to formation of the structure of the salinity field in the Georgian coastal area. (a) t = 24 h (b) t = 72 h Fig. 3. The salinity fields (psu) on depth of 10 m predicted by RM-IG at 24 h (a) and 72 h (b). (a) t = 24 h (b) t = 72 h Fig. 4. The salinity fields (psu) on depth of 10 m predicted by BSM of MHI at 24 h (a) and 72 h (b). Finally, it should be noted that it was not possible to verify results of the forecast by comparison with the real data because of absence of the observational data for the considered period. However, such comparisons have been done during pilot experiment within the project ARENA in 2005, which showed an ability of the RM-IG to predict hydrophysical fields with sufficient accuracy [10]. References 1. Kordzadze A., Demetrashvili D. Modeling of dynamical processes in the Black Sea. Georgian Elecreonic Scientific Journal (GESJ): Physics. 2010, N 1(3), http://gesj.internet-academy.org.ge/phys/, p. 25-45. 2.Kordzadze A. A., Demetrashvivli D. I. J. Georgian Geophys. Soc. 2010 3.Kordzadze A. A., Demetrashvili D. I. Operative forecast of hydrophysical fields in the Georgian Black Sea coastal zone within the ECOOP. Ocean Sci. Discuss., 8, 2011, doi: 10.5194/osd-8-397-2011, www.ocean-sci-discuss.net/8/397/2011/, 2011, p.397-433. 4. Korotaev G., Cordoneanu E., Dorofeev V., Fomin V., Grigoriev A., Kordzadze A., Kubriakov A., Oguz T., Ratner Yu., Trukhchev D., Slabakov H.: Near-operational Black Sea nowcasting/forecasting system, in: European Operational Oceanography: Present and Future. 4th EuroGOOS Conference, 6-9 June 2005, Brest, France, 2006, p.269-275. . 5. Kubryakov A., Grigoriev A., Kordzadze A., Korotaev G., Trukhchev D., Fomin V. Nowcasting/Forecasting subsystem of the circulation in the Black Sea nearshore regions, in: European Operational Oceanography: Present and Future. 4th EuroGOOS Conference, 6-9 June 2005, Brest, France, 2006, p. 605-610. 6. Kordzadze A. A., Demetrashvili D. I., Surmava A. A.: Numerical modeling of hydrophysical fields of the Black Sea under the conditions of alternation of atmospheric circulation processes, Izvestiya RAS, Atmospheric and Oceanic Physics, 2008, Vol. 44, No 2, p. 213-224. 7. Marchuk G. I., Kordzadze A. A., Skiba Yu. N.: Calculation of major hydrological fields of the Black Sea on the basis of the splitting method., Izvestiya USSR, Atmos. Ocean. Phys., 1975, 30 11, p.379–393. 8. Marchuk G. I., Kordzadze A. A., Zalesnyi V. B.: Problem of mathematical modelling of sea and ocean currents. In: Differential and Integral Equations: Boundary-Value Problems, Tbilisi, 99–151, 1979, p. 99-151 (in Russian). 9.tMarchuk G. I., Kordzadze A. A. Perturbation theory and the formulation of inverse problem of ocean dynamics, Proceedengs of Tbelese State University, Mathematica, Mekhanica, Astronomia, 1986, 259 (19–20), p. 49–65 (in Russian). 10.Kordzadze A. A.: Mathematical modelling of sea currents (theory, algorithms, numerical experiments) Moscow, OVM AN SSSR, 218 p., 1989 (in Russian). 11.Zilitinkevich, S. S. and Monin, A. S.: Turbulence in Dynamic Models of the Atmosphere, Nauka, Leningrad, 1971, 41 p, 1971 (in Russian). 12.Marchuk G. I., Kochergin V. P., Sarkisyan A. S., Bubnov M. A., Zalesny V. B., Klimok V. I., Kordzadze A. A., Kuznetsov V. I., Protasov A. B., Sukhorukov B. A., Tsvetova E. A., Scherbakov A. B., et al. Mathematical models of ocean circulation. Nauka, Novosibirsk, 1980, 288 p (in Russian). 13.Marchuk G. I. Numerical Solution of Problems of Atmospheric and Oceanic Dynamics, Gidrometeoizdat, Leningrad, 1974, 303 p (in Russian). 14. Korotaev G., Oguz T., Nikiforov A., Koblinsky C. Seasonal, interannual, and mesoscale variability of the Black Sea upper layer circulation derived from altimeter data, J. Geophys. Res. 2003, Vol. 108, No C4. 3122, doi:10.1029/2002JC001508. 15. Korotenko K. A., Dietrich D. Е., Bouman M. J. Modeling circulation and oil spill transport in the Black Sea. Okeanologiya, 2003, Vol. 43, No 3, p. 367-378. Savi zRvis mdgomareobis prognozi saqarTvelos sanapiro zolSi avTandil korZaZe, demuri demetraSvili Aabstraqti evrokavSiris saerTaSoriso samecniero proeqtebis ARENA da ECOOP farglebSi iv. javaxiSvilis Tbilisis saxelmwifo universitetis m. nodias geofizikis institutSi SemuSavebulia Savi zRvis mdgomareobis regionaluri prognozuli sistema, romelic saSualebas iZleva gavTvaloT Savi zRvis dinebebis, temperaturisa da marilianobis samganzomilebiani velebis 3 dRiani prognozebi maRali garCevisunarianobiT (1 km horizontaluri sivrciTi bijiT) Savi zRvis ukidures aRmosavleT nawilSi. aRniSnuli sistema, romelic Semadgeneli nawilia mTlianad Savi zRvis diagnozisa da prognozis sistemisa, dafuZnebulia Savi zRvis dinamikis regionalur baroklinur modelze. regionaluri modelis bade Cadgmulia ukrainis erovnuli mecnierebaTa akademiis zRvis hidrofizikis institutis (zhi, q. sevastopoli/ukraina) Savi zRvis zogadi cirkulaciis maTematikuri modelis saTvlel badeSi (5 km horizontaluri sivrciTi bijiT). regionaluri prognozuli sistemis operatiuli funqcionirebisaTvis saWiro yvela monacemis miReba xdeba yoveldRiurad zhi-dan ftp saitis meSveobiT. warmodgenili naSromis mizania Savi zRvis mdgomareobis regionaluri prognozuli sistemis aRwera da am sistemis funqcionirebis ilustracia zogierTi prognozis Sedegis ganxilviT.
