EXPERIMENTS: - Ecological Society of America
advertisement
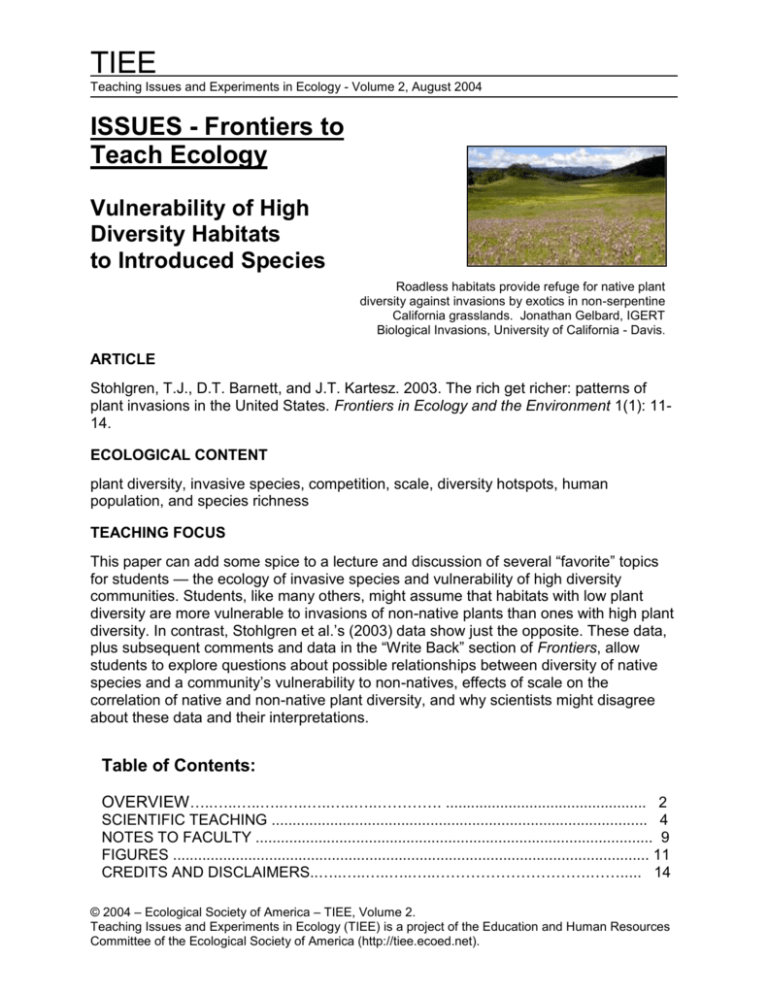
TIEE Teaching Issues and Experiments in Ecology - Volume 2, August 2004 ISSUES - Frontiers to Teach Ecology Vulnerability of High Diversity Habitats to Introduced Species Roadless habitats provide refuge for native plant diversity against invasions by exotics in non-serpentine California grasslands. Jonathan Gelbard, IGERT Biological Invasions, University of California - Davis. ARTICLE Stohlgren, T.J., D.T. Barnett, and J.T. Kartesz. 2003. The rich get richer: patterns of plant invasions in the United States. Frontiers in Ecology and the Environment 1(1): 1114. ECOLOGICAL CONTENT plant diversity, invasive species, competition, scale, diversity hotspots, human population, and species richness TEACHING FOCUS This paper can add some spice to a lecture and discussion of several “favorite” topics for students — the ecology of invasive species and vulnerability of high diversity communities. Students, like many others, might assume that habitats with low plant diversity are more vulnerable to invasions of non-native plants than ones with high plant diversity. In contrast, Stohlgren et al.’s (2003) data show just the opposite. These data, plus subsequent comments and data in the “Write Back” section of Frontiers, allow students to explore questions about possible relationships between diversity of native species and a community’s vulnerability to non-natives, effects of scale on the correlation of native and non-native plant diversity, and why scientists might disagree about these data and their interpretations. Table of Contents: OVERVIEW…..…..…..…..…..…..…..…..…………. ................................................ 2 SCIENTIFIC TEACHING .......................................................................................... 4 NOTES TO FACULTY ............................................................................................... 9 FIGURES .................................................................................................................. 11 CREDITS AND DISCLAIMERS..…..…..…..…..…..………………………….……..... 14 © 2004 – Ecological Society of America – TIEE, Volume 2. Teaching Issues and Experiments in Ecology (TIEE) is a project of the Education and Human Resources Committee of the Ecological Society of America (http://tiee.ecoed.net). page 2 TIEE Volume 2, August 2004 OVERVIEW Stohlgren et al. (2003) In their introduction Stohlgren et al. (2003) state that as recently as 2002 ecologists proposed that diverse communities can effectively exclude non-native species. They say “It would be comforting to believe that areas with many plant species are less prone to invasions than those with fewer species. Botanical hotspots … might repel the frequent arrival of plants from other regions ... [and] control techniques might be limited to heavily invaded, species-poor areas …” However, they point out that exceptions to this assumption are obvious, such as the spread of tamarisk, Russian olive, and purple loostrife to species-rich wetlands. The paper is based on two large data sets. The first is from 316 large vegetation monitoring plots in eight states under the auspices of the United States Department of Agriculture (USDA). The plots are spaced (one per every 63,942 ha) throughout the United States (US). Each consists of four 168 m2 subplots with three 1 m2 quadrants in each subplot. Plots were sampled once each summer between 1997 and 2001. The Biota of North America Program directed the second data collection over 20 years from 44 states. This is based on 229,000 records of native and non-native plants by county. Figures 1 and 2 in Stohlgren et al. are the Biota of North America data. Both show a positive correlation between non-native and native plants throughout the US. The authors conclude that areas rich in native plants also support more non-natives; that “the rich get richer.” They acknowledge that there may not be any direct causeeffect relationship. Species richness of both natives and invasives may be correlated to habitat heterogeneity; high species turnover; and/or increased pulses of light, nitrogen, or water. They end with the question: “How are so many species-rich areas successfully invaded?” Response by M. Rejmanek (2003) In a subsequent issue of Frontiers, Rejmanek questions the data and conclusions of Stohlgren et al.. This letter includes a figure (see Figures/Tables) showing a positive relationship between human population in a state and number of non-native plant species. Rejmanek states that “Admittedly, the whole question of major patterns of nonnative species richness in the US is more complicated (data are not independent but auto-correlated). One point, however, is clear: the human population size and the length of intensive disturbance/introduction history are the two primary factors in determining species richness of non-native flora.” Rejmanek points out that the positive correlation Stohlgren et al.’s Figure 2 is due to an outlier, California, and that removal of these data greatly reduces the significance of the relationship. He uses a stepwise regression analysis of plant data from 50 states to © 2004 – Ecological Society of America – TIEE, Volume 2. Teaching Issues and Experiments in Ecology (TIEE) is a project of the Education and Human Resources Committee of the Ecological Society of America (http://tiee.ecoed.net). TIEE: ISSUES Vulnerability of High Diversity Habitats page 3 show that human population size (H) in a state explains 60% of the variance for the regression. Further, “… when H is included as an independent variable, together with native species richness, contribution of the last variable becomes non-significant and negative (Table 1, regression 2).” Rejmanek concludes that “Based on stepwise regression analysis, the best available predictors of non-native species richness are H1/2 and the time since the state was admitted to the Union ...[which] is used as a surrogate for the length of intensive disturbance/introduction history.” Response by IJ Renee and BF Tracy (2003) In this letter, Renne and Tracy argue that small scale studies do allow for control of environmental factors, however this is not possible in Stolgren et al.’s large scale analysis (see Notes to Faculty for more details). REFERENCES Rejmanek, M. 2003. The rich get richer – responses. 2003. Frontiers in Ecology and the Environment 1(3): 122-123. Renne, I.J. and B.F. Tracy. 2003. The rich get richer – responses. Frontiers in Ecology and the Environment 1(3): 122. Stohlgren, T.J., D.T. Barnett, and J.T. Kartesz. 2003. The rich get richer: patterns of plant invasions in the United States. Frontiers in Ecology and the Environment 1(1): 11-14. © 2004 – Ecological Society of America – TIEE, Volume 2. Teaching Issues and Experiments in Ecology (TIEE) is a project of the Education and Human Resources Committee of the Ecological Society of America (http://tiee.ecoed.net). page 4 TIEE Volume 2, August 2004 SCIENTIFIC TEACHING AND ACTION RESEARCH Although ecology faculty have extensive research training, most do not realize that they can do research in their own courses. This is a different kind of research than we are used to — often not controlled, without replicates, and so on. But it is still research because we can develop hypotheses, ask specific questions based on these hypotheses, and then collect and analyze data which in turn inform the questions and hypotheses. There are numerous journals dedicated to interesting research on teaching (e.g., Journal of Research in Science Teaching). One type of classroom research is called “Action Research.” In this type of research, faculty ask specific questions about their students or their teaching, gain information about these questions, and use this information to learn about teaching and their course in particular. A list of Action Research websites are provided below. Action research is an aspect of “Scientific Teaching” (Handelsman et al. 2004). Below we describe a four-step process which you can use to conduct research on your use of the Frontiers article. The theoretical bases for this TIEE Scientific Teaching are three areas of research on learning (D’Avanzo 2003 a,b): metacognition (knowing what we know), misconceptions (firmly held beliefs that are incorrect) and adult development stage theory (stages that learners are thought to go through as their thinking about a discipline matures). Action Research with the Stolgren article: Misconceptions About Correlation versus Cause Misconceptions: Students come to class with background knowledge that may or may not be correct; when incorrect this information is called a misconception (or prior/alternative/intuitive conception). Students’ misconceptions are notoriously difficult to change, and numerous studies show that students come to class — and leave — with the same content misinformation even when the content is directly dealt with in a class. (See website below for more information) You can use this article to address a misconception shared by many students: that correlation signifies cause. That students have this misconception may surprise you – which is one of the reasons students retain these alternative conceptions. Faculty are unaware of them! Students, like most people, confuse correlation and cause. This is understandable since we notice relationships every day that we assume to be causally related. (This is called “make sense” reasoning.) Sometime there is a causal relationship — for instance, when we eat food we understand that our hunger decreases because of the sugar and other nutrients the food contains. Of course the coincidence of two events does not mean that one causes the other. It is important for students to appreciate that a major challenge in ecology, and all sciences, © 2004 – Ecological Society of America – TIEE, Volume 2. Teaching Issues and Experiments in Ecology (TIEE) is a project of the Education and Human Resources Committee of the Ecological Society of America (http://tiee.ecoed.net). TIEE: ISSUES Vulnerability of High Diversity Habitats page 5 is to determine whether events that happen together are causally associated. This lesson will serve students well as they attempt to understand controversies they see everyday, such as sorting out the likely causal relationships between smoking and lung cancer. Two online statistics texts that discuss the cause/correlation confusion, including silly positive correlation examples (such as number of popsicles sold and drownings), are http://davidmlane.com/hyperstat/A62692.html and http://business.clayton.edu/arjomand/book/sbk17.htm. Doing Action Research with this Issue The hypothesis you are addressing is: When I use this Issue as a way to discuss correlation versus cause in class, my students’ understanding of the difference between cause and correlation improves. We suggest that you follow the four-step process outlined below: 1) a pre-test to assess your students’ knowledge about cause versus correlation, 2) using the Issue as a vehicle for teaching about this difference, 3) a posttest to assess change in students’ knowledge, and 4) reflection on your findings. Step One: Pre-Test — Ask your students to write a Minute Paper in response to the question below. It is easiest to do this at the beginning or end of a class session. Explain to them, in general terms, why you are asking them to do this; stress that this is not a test and that their answers will be anonymous. In the next class session, generally report what you learned from the minute papers and use this as a lead-in to using the Issue in class, however you choose to do that (see “Notes to Faculty”). NOTE ON CLASS SIZE: In a small-medium size class, you can read through all of the answers. In a large class, read a sub-sample. In big classes, logistics of collecting Minute Papers can be formidable, so come up with a reasonably simple solution. For instance, some faculty with classes of 300 or more students give out index cards in class, allow students 5 minutes to hand write an answer at the end of class (to a projected question), and ask students to drop the cards in boxes placed at the exit doors. © 2004 – Ecological Society of America – TIEE, Volume 2. Teaching Issues and Experiments in Ecology (TIEE) is a project of the Education and Human Resources Committee of the Ecological Society of America (http://tiee.ecoed.net). page 6 TIEE Volume 2, August 2004 Minute Paper Question: (Project or hand out both the question and the figure. Clearly tell students how much time they have and what to do with their answers.) Briefly (50-100 words) respond to Fred’s interpretation of the graph below. The graph shows ocean water temperature on the X axis and the number of shark attacks per 100,000 swimmers in Australia on the Y axis (this is a “made up” example). Do you agree with Fred? Fred’s interpretation: Looking at this graph I can see that warm water causes more shark attacks for swimmers in Australia. © 2004 – Ecological Society of America – TIEE, Volume 2. Teaching Issues and Experiments in Ecology (TIEE) is a project of the Education and Human Resources Committee of the Ecological Society of America (http://tiee.ecoed.net). TIEE: ISSUES Vulnerability of High Diversity Habitats page 7 Step Two: Teaching — use the “Rich/Richer” article(s) in your class, putting special emphasis on correlation, the difference between correlation and cause, and why this distinction is important for students to understand. (Examples of various approaches you can use are in the "Table of Student-Active Approaches"; the easiest one is “turnto-your neighbor”). The first question in the “Notes to Faculty” deals with cause and effect relationships. There are several good examples of silly relationships in the resources, or you can make up your own. Step Three: Post-test — The purpose of the post-test is to assess the impact of your teaching on students’ understanding of correlation and causation. How you do this depends in part, of course, on their pre-test essays. Here are a few ideas: At the end of the class in which you use the Issue (or the next class), ask students to do another minute paper similar to the pre-test one. For instance, ask students to respond to the following: Researchers have found that people over 50 who drink one or two glasses of red wine each day have fewer heart attacks. Does this mean that something in red wine causes fewer heart attacks for these people? Use another CAT (Classroom Assessment Technique) such as the “muddiest point” or “directed paraphrasing” to obtain immediate feedback at the end of your discussion or lecture in which you discuss correlation and causation. On the next exam, add an “extra point” question focused on correlation/causation. Step Four: Reflection and Response — This is probably the hardest part of the whole process — once you have your “data,” what do you do with it? This kind of evaluation is a way for you to think more deeply about your students’ learning — what you really want them to learn and what inhibits them from achieving this goal. When done well, classroom research like this can help make students’ thinking more transparent — so that you can better design on ways to “get through” to them. The idea is to reflect on their learning as opposed to your teaching. Discussing your findings with a trusted and knowledgeable colleague may be the best thing to do, if you have such a colleague. The ESA’s ECOLOG discussion list (ECOLOG-L@LISTSERV.UMD.EDU) is used by ecology faculty and another venue to share your findings. What you do in the class of course depends on what you have learned and also the time you can spend on follow-up. At a minimum, you should report back to the students and give an overview of their answers (good points and ones many missed) and use this as a way to again discuss the contrast between correlation and causation. If students made good progress between the pre and post-tests, say so and praise them. Don’t expect a big change; modest growth as a result of one class session is a real achievement. © 2004 – Ecological Society of America – TIEE, Volume 2. Teaching Issues and Experiments in Ecology (TIEE) is a project of the Education and Human Resources Committee of the Ecological Society of America (http://tiee.ecoed.net). page 8 TIEE Volume 2, August 2004 REFERENCES D’Avanzo, C. 2003a. Application of research on learning to college teaching: ecological examples. BioScience 53: 1121-1128. D’Avanzo, C. 2003b. Research on learning: Potential for improving college science teaching. Frontiers for Ecology and the Environment 1: 533-540. Handelsman, J. et al. 2004. Scientific Teaching. Science 304: 521-522. RESOURCES General Handelsman, J., D. Ebert-May, R. Beichner, P. Bruns, A. Chang, R. DeHaan, J. Gentile, S. Lauffer, J. Stewart, S. M. Tilghman, and W. B. Wood. 2004. Scientific Teaching, Science. 304: 521-522. Action Research Good overview and history of action research (http://www.infed.org/research/b-actres.htm) Overview with focus on curriculum development (http://informationr.net/ir/1-1/paper2.html) San Jose State University; brief overview and ideas for how to start (http://www.accessexcellence.org/21st/TL/AR/) University of Colorado site; has many articles (http://carbon.cudenver.edu/~mryder/itc/act_res.html) Correlation versus Cause A Lesson in Correlation vs Causation From “Biology Brought to Life” by Jo Handlesman; brief discussion includes description of Koch’s experiments with bacteria — a straightforward and interesting example of an experiment showing cause and effect. Online Statistics Texts HyperStat Online Textbook by David M. Lane, Rice University (http://davidmlane.com/hyperstat/index.html) Introductory Statistics, David W. Stockburger, SMSU 1998 ed (http://business.clayton.edu/arjomand/book/sbk00.htm) Statistics at Square One, T. D. V. Swinscow (http://bmj.bmjjournals.com/collections/statsbk/index.shtml) © 2004 – Ecological Society of America – TIEE, Volume 2. Teaching Issues and Experiments in Ecology (TIEE) is a project of the Education and Human Resources Committee of the Ecological Society of America (http://tiee.ecoed.net). TIEE: ISSUES Vulnerability of High Diversity Habitats page 9 NOTES TO FACULTY The emphasis in TIEE Issues is use of figures and tables for discussion and other types of student-active teaching and learning. These notes will give you ideas about using the figures in this paper in your ecology class. The StudentActive Teaching table will introduce you to a variety of approaches you can use in your class to actively engage your students. To see an essay on leading good discussions, go to Guided Class Discussions. You can use these data and the overall disagreement to get your students to think more carefully about effects of invasive non-natives on native plants and communities, resilience and vulnerability of communities to invasive plants, and possible mechanisms regulating species diversity and introductions. Below are several ways you can use these figures and the table to stimulate discussion about these and related topics (use some of the questions below as well). Note: Turn-to-Your-Neighbor is an easy and effective group approach you can use in large classes. 1. Project or hand out Stohlgren et al.’s Figure 2. With the class as a whole or in small groups (no more than 5 students per group), ask students to first describe and then interpret this figure. (Ahead of time explain y, r, and p and the source of the data). For students working in groups, ask each group to present one question or comment they have about the figure. You can call on one group at random to describe and interpret the figure, and then ask for additional comments/questions. 2. Project or hand out Stohlgren et al.’s Figure 1 and/or 2. Describe and interpret these figures yourself (including data sources) and the significance of this result. Then project or hand out Rejmanek’s Figure 1. Ask the class as a whole or students working in small groups to explain how this figure and the accompanying diagram differ from Stohlgren et al.’s data, e.g., what they learn and think about with these different data. Again, if students work in groups, ask for volunteers or call on a group at random when you bring them together for discussion. Questions for discussion: 1. Stohlgren et al. say that there may not be direct cause-effect relationship between diversity of native and non-native plants. Instead, both may be correlated to another factor or factors such as habitat heterogeneity. What do they mean by “direct cause-effect relationship” and why is the relationship they show “indirect?” Explain how diversity of non-native and native plants might be correlated to habitat heterogeneity. What does that mean? 2. Why did Stohlgren et al. do this analysis? What questions were they asking and why? How might their findings change management of non-native plant invasions and conservation of species-rich areas? © 2004 – Ecological Society of America – TIEE, Volume 2. Teaching Issues and Experiments in Ecology (TIEE) is a project of the Education and Human Resources Committee of the Ecological Society of America (http://tiee.ecoed.net). page 10 TIEE Volume 2, August 2004 3. What question was Rejmanek addressing? Why is this interesting? Does his finding negate the results of Stohlgren et al.? Rejmanek includes a diagram with his figure; why? What is he doing with this diagram that is different from the data presentation of Stohlgren et al.? Questions of scale Another response to Stohlgren et al. by Renne and Tracy (2003) concerns the effect of scale on possible relationships between diversity and invisibility. The authors argue that the large scale of Stohlgren et al.’s analysis does not allow for control of environmental factors and that small scale studies do allow for isolation of such factors. They say that “…the ability to manipulate both local neighborhood interactions and environmental factors can elucidate their relative contribution towards community invisibility. Without these estimates, we fail to explain the processes affecting invasion patterns, and thus cannot offer effective management strategies.” This quote could lead to a good discussion about experimental design in regard to scale and application of results for management purposes. Fig. 7 from from Stohlgren, T.J. et al. 1999. (Exotic plant species invade hot spots of native plant diversity. Ecol. Monogr. 69: 25-46) does address the scale issue and is included in the Figure section for that reason. REFERENCE(S) Renne and Tracy. 2003. The rich get richer – responses. Frontiers in Ecology and the Environment 1(3): 122. RESOURCES http://www.invasivespecies.gov (node to federal and state sites) http://tncweeds.ucdavis.edu/links.html (Nature Conservancy links) http://www.invasive.org (USDA and other agencies; can search for images and species) http://invasivespecies.nbii.gov (Information node of the Center for Biological Informatics of the U.S. Geological Survey) http://www.esa.org/sbi/sbi_issues/ (ESA Issues in Ecology includes one on invasives) © 2004 – Ecological Society of America – TIEE, Volume 2. Teaching Issues and Experiments in Ecology (TIEE) is a project of the Education and Human Resources Committee of the Ecological Society of America (http://tiee.ecoed.net). TIEE: ISSUES Vulnerability of High Diversity Habitats page 11 Figure 2 from Stohlgren, T.J., D.T. Barnett, and J.T. Kartesz. 2003. The rich get richer: patterns of plant invasions in the United States. Frontiers in Ecology and the Environment 1(1): 11-14. © 2004 – Ecological Society of America – TIEE, Volume 2. Teaching Issues and Experiments in Ecology (TIEE) is a project of the Education and Human Resources Committee of the Ecological Society of America (http://tiee.ecoed.net). page 12 TIEE Volume 2, August 2004 Figure 1 from Rejmanek, M. 2003. The rich get richer – responses. 2003. Frontiers in Ecology and the Environment 1(3): 122-123. © 2004 – Ecological Society of America – TIEE, Volume 2. Teaching Issues and Experiments in Ecology (TIEE) is a project of the Education and Human Resources Committee of the Ecological Society of America (http://tiee.ecoed.net). TIEE: ISSUES Vulnerability of High Diversity Habitats page 13 Figure 7 from Stohlgren, T.J. et al. 1999. Exotic plant species invade hot spots of native plant diversity. Ecol. Monogr. 69: 25-46. © 2004 – Ecological Society of America – TIEE, Volume 2. Teaching Issues and Experiments in Ecology (TIEE) is a project of the Education and Human Resources Committee of the Ecological Society of America (http://tiee.ecoed.net). page 14 TIEE Volume 2, August 2004 CREDITS AND DISCLAIMERS CREDITS FOR THIS EXPERIMENT: This submission was greatly improved by comments from anonymous reviewers. GENERIC DISCLAIMER: The Ecological Society of America (ESA) holds the copyright for TIEE Volume 2, and the authors retain the copyright for the content of individual contributions (although some text, figures, and data sets may bear further copyright notice). No part of this publication may be reproduced, stored in a retrieval system, or transmitted, in any form or by any means, electronic, mechanical, photocopying, recording, or otherwise, without the prior written permission of the copyright owner. Use solely at one's own institution with no intent for profit is excluded from the preceding copyright restriction, unless otherwise noted. Proper credit to this publication must be included in your lecture or laboratory course materials (print, electronic, or other means of reproduction) for each use. To reiterate, you are welcome to download some or all of the material posted at this site for your use in your course(s), which does not include commercial uses for profit. Also, please be aware of the legal restrictions on copyright use for published materials posted at this site. We have obtained permission to use all copyrighted materials, data, figures, tables, images, etc. posted at this site solely for the uses described in the TIEE site. Lastly, we request that you return your students' and your comments on this activity to Susan Musante (tieesubmissions@esa.org), Managing Editor for TIEE, for posting at this site. © 2004 – Ecological Society of America – TIEE, Volume 2. Teaching Issues and Experiments in Ecology (TIEE) is a project of the Education and Human Resources Committee of the Ecological Society of America (http://tiee.ecoed.net).
