Function and Graphs
advertisement
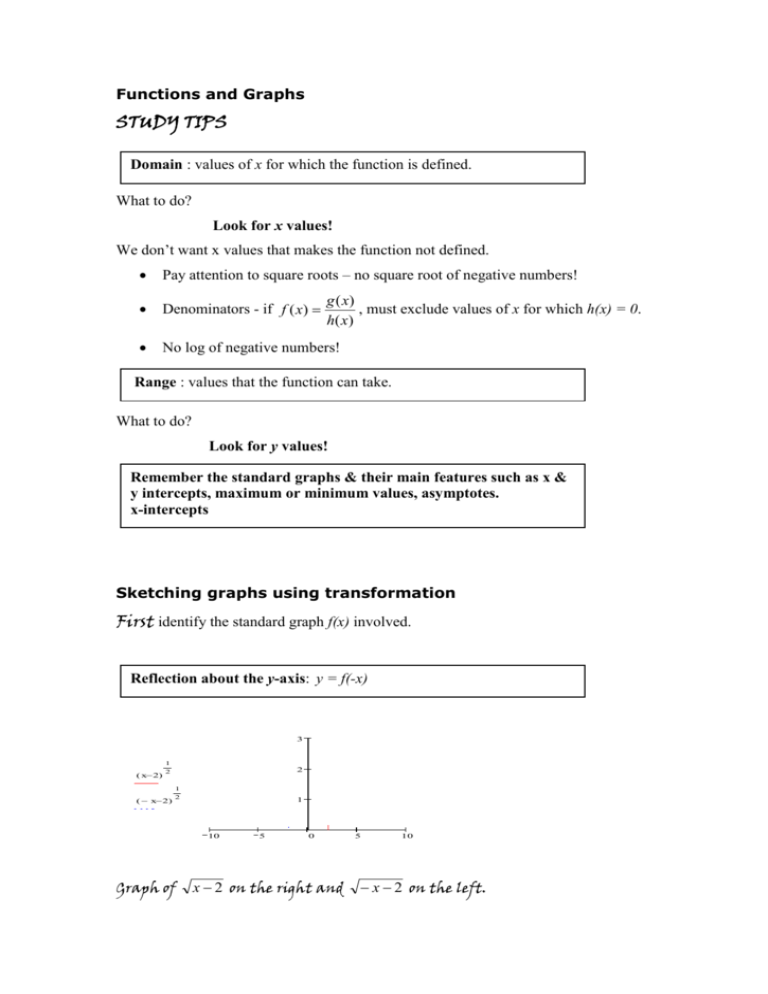
Functions and Graphs STUDY TIPS Domain : values of x for which the function is defined. What to do? Look for x values! We don’t want x values that makes the function not defined. Pay attention to square roots – no square root of negative numbers! Denominators - if f ( x) No log of negative numbers! g ( x) , must exclude values of x for which h(x) = 0. h( x ) Range : values that the function can take. What to do? Look for y values! Remember the standard graphs & their main features such as x & y intercepts, maximum or minimum values, asymptotes. x-intercepts Sketching graphs using transformation First identify the standard graph f(x) involved. Reflection about the y-axis: y = f(-x) 3 ( x 2) 1 2 2 1 ( x 2) 2 1 10 5 0 5 10 x Graph of x 2 on the right and x 2 on the left. Any initial x intercept, x = a is reflected to the point x = –a. Any vertical asymptote at the line x = b is reflected to the line x = -b. Reflection about the x-axis: y = -f(x) 4 2 1 ( x 2) 2 1 ( x 2) 4 2 0 2 4 2 2 4 x Graph of x 2 above the x-axis and x 2 below the x-axis. Any initial y intercept, y= c is reflected to the point y = –c. Any horizontal asymptote at the line y = b is reflected to the line y = -b. X shift : y = f(x-a) 5 ln( x) ln( x 2) 0 1 2 3 4 5 x Graph of ln x on the left and ln( x 2) on the right. The whole graph slides to the right or left. In the example above, it is a shift to the right because a is positive. If a is negative, it is shift to the left. Don’t forget to move everything with f, a units to the right or right: including any x-intercepts, asymptotes etc. Y Stretch : y = k * f(x) Graph is stretched along the y-axis. The whole function is multiplied by k. 5 ln( x) 5 ln( x) 0 0.5 ln( x) 1 2 3 4 5 x FOR MULTIPLE TRANSFORMATIONS, DO ONE AT A TIME!. Make sure you determine the correct initial standard function involved. For this, try to write the final function in terms of the initial function. For example, if f ( x) log( 1 2 x) 1 Start with 1. g ( x) log( 2 x) The shape of this graph is like that of log(x) with different x intercept. Find it first! When log( 2 x) 0 , x 1 . 2 Vertical asymptote at x = 0. 5 log( 2x) 0 1 2 3 4 5 x 2. g ( x) log( 2 x) means reflection about the y-axis. 1 2 x-intercept of this graph is at x Remember the y-axis is still a vertical asymptote. 5 log( 2x) 4 2 0 5 1x 1 3. But log( 1 2 x) log[ 2( x )] means that moving the graph above unit to the 2 2 right. 1 1 0 now! 2 2 The x-intercept is at The vertical asymptote is also moved x 1 . 2 1 unit to the right as well. Now at 2 5 log( 12x) 2 0 2 5 x 4. Finally, f ( x) log( 1 2 x) 1 shifts the graph 1 unit upwards cutting the y-axis at y = 1. 5 log( 12x) 1 2 0 5 x 2
