ICNEE_mazza_dimitrova_paper_final
advertisement
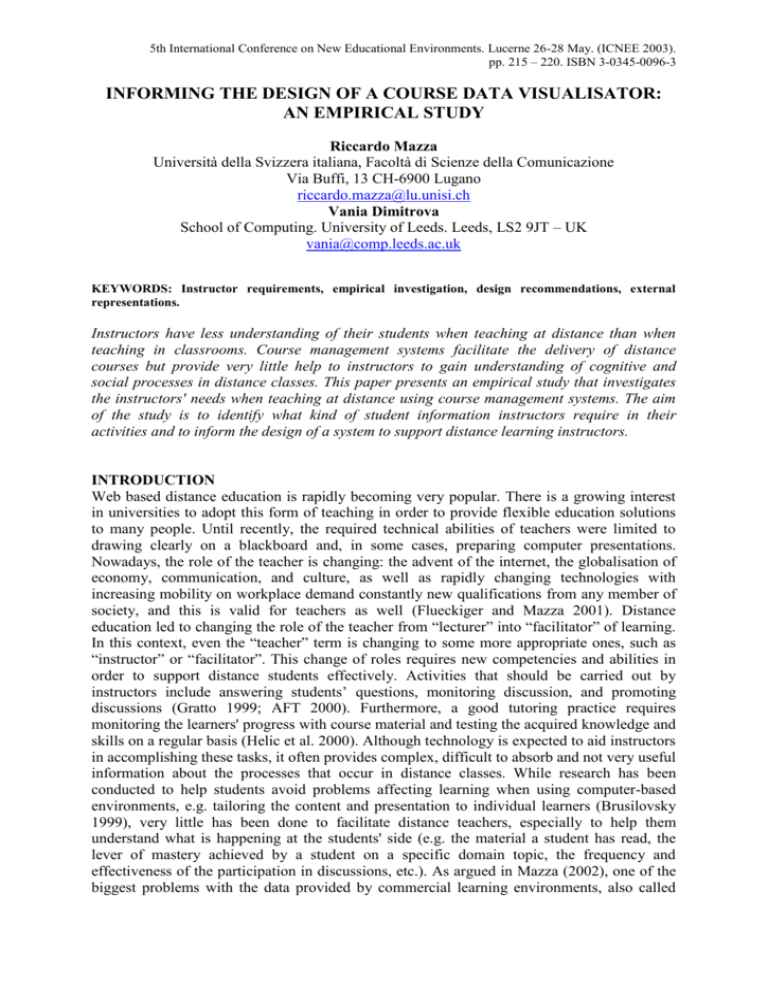
5th International Conference on New Educational Environments. Lucerne 26-28 May. (ICNEE 2003). pp. 215 – 220. ISBN 3-0345-0096-3 INFORMING THE DESIGN OF A COURSE DATA VISUALISATOR: AN EMPIRICAL STUDY Riccardo Mazza Università della Svizzera italiana, Facoltà di Scienze della Comunicazione Via Buffi, 13 CH-6900 Lugano riccardo.mazza@lu.unisi.ch Vania Dimitrova School of Computing. University of Leeds. Leeds, LS2 9JT – UK vania@comp.leeds.ac.uk KEYWORDS: Instructor requirements, empirical investigation, design recommendations, external representations. Instructors have less understanding of their students when teaching at distance than when teaching in classrooms. Course management systems facilitate the delivery of distance courses but provide very little help to instructors to gain understanding of cognitive and social processes in distance classes. This paper presents an empirical study that investigates the instructors' needs when teaching at distance using course management systems. The aim of the study is to identify what kind of student information instructors require in their activities and to inform the design of a system to support distance learning instructors. INTRODUCTION Web based distance education is rapidly becoming very popular. There is a growing interest in universities to adopt this form of teaching in order to provide flexible education solutions to many people. Until recently, the required technical abilities of teachers were limited to drawing clearly on a blackboard and, in some cases, preparing computer presentations. Nowadays, the role of the teacher is changing: the advent of the internet, the globalisation of economy, communication, and culture, as well as rapidly changing technologies with increasing mobility on workplace demand constantly new qualifications from any member of society, and this is valid for teachers as well (Flueckiger and Mazza 2001). Distance education led to changing the role of the teacher from “lecturer” into “facilitator” of learning. In this context, even the “teacher” term is changing to some more appropriate ones, such as “instructor” or “facilitator”. This change of roles requires new competencies and abilities in order to support distance students effectively. Activities that should be carried out by instructors include answering students’ questions, monitoring discussion, and promoting discussions (Gratto 1999; AFT 2000). Furthermore, a good tutoring practice requires monitoring the learners' progress with course material and testing the acquired knowledge and skills on a regular basis (Helic et al. 2000). Although technology is expected to aid instructors in accomplishing these tasks, it often provides complex, difficult to absorb and not very useful information about the processes that occur in distance classes. While research has been conducted to help students avoid problems affecting learning when using computer-based environments, e.g. tailoring the content and presentation to individual learners (Brusilovsky 1999), very little has been done to facilitate distance teachers, especially to help them understand what is happening at the students' side (e.g. the material a student has read, the lever of mastery achieved by a student on a specific domain topic, the frequency and effectiveness of the participation in discussions, etc.). As argued in Mazza (2002), one of the biggest problems with the data provided by commercial learning environments, also called 5th International Conference on New Educational Environments. Lucerne 26-28 May. (ICNEE 2003). pp. 215 – 220. ISBN 3-0345-0096-3 Course Management Systems (CMS), is that it is in a numerical tabular format, often incomprehensible, with a poor logical organisation, and difficult to follow. Our research aim is to investigate possible ways of helping distance teachers gain understanding of their students. Specifically, we consider the use of Information Visualisation techniques (Tufte 1990; Spence 2001) to aid teachers in understanding data from course management systems. Information Visualization exploits graphical representations to render a vast amount of abstract data to help people comprehend and interpret the data. By managing complex multi-dimensional data with appropriate visualization techniques instructors may be facilitated to form mental models of the data and obtain a better understanding of specific features of the data (Spence 2001). Techniques for graphically externalising student data have been applied in learning systems, e.g. VisMod (Zapata & Greer, 2001) uses concept maps to render a Bayesian student model. Reffay and Chanier (2002) analyse interactions between students by using Social Network Analysis (Scott 1991). However, these systems are implemented as prototypes and are difficult to utilise in commercial CMSs. We are implementing CourseVis: a tool for graphically representing students’ information in on-line courses managed with commercial CMSs. A study was conducted to examine what kind of information the instructors require for their distance teaching activities and to identify possible ways to help teachers gain understanding of this information. This paper presents a summary of the major findings from a survey that we submitted to distance learning instructors to identify their needs when running on-line course. Based on the results of the study, we will draw recommendations how to help teachers gain a better understanding of cognitive, social and behavioural aspects about individual students in on-line distance teaching. These requirements are used to inform the design of CourseVis. THE EMPIRICAL STUDY In order to investigate what information about students instructors need in distance learning courses, we conducted a questionnaire with people involved in distance learning. Objectives The aim of the survey was to elicit answers to the following themes: Social aspects that tutors can be interested in. These may be various kinds of interactions that occur in a web based course management system, namely, interactions between students, interactions between students and the teacher, interactions between students and the system, and vicarious interactions1. Cognitive aspects that tutors can be interested in. These can be the students' overall course performance, their performance on a selected evaluation proof, such as quiz or assignment, the measured students' performance on a specific topic of the course, etc. Behavioural aspects that tutors can be interested in. These include identifying specific features of students' behaviour, for instance, the students' attendance in the course, students performing very well or very badly, students that are progressing too fast or too slowly with the course schedule, etc. Participants and settings The participants in this survey were instructors involved in distance learning courses. Particularly, we contacted people involved in the Swiss national research program "Swiss Virtual Campus", people from the ICLT2 group at Leeds University, the IFETS mailing list3 1 Vicarious interaction takes place when a student actively observes and processes the interaction between other students or between other students and the instructor, without taking an active part in interaction (Sutton, 2001). 2 ICLT stands for "Interaction, Communication and Learning Technologies", for details see http://cbl.leeds.ac.uk/~aisha/iclt/home.html. 5th International Conference on New Educational Environments. Lucerne 26-28 May. (ICNEE 2003). pp. 215 – 220. ISBN 3-0345-0096-3 (well-known among distance teachers around the world), some people that participated in past seminars organised by the Global Educators' Network of the Canadian TeleLearning Network of Centres of Excellence (TL*NCE)4, and, finally, some people involved as instructors in online courses in the UK and in Switzerland and whom we knew personally. Procedure The questionnaire was prepared in a Web form and located at a Web server in Lugano 5. An email message was sent out to 188 individuals and to the mailing list. The e-mail explained the purpose of the study, encouraged recipients to respond to the survey on a voluntary basis, and provided the address of the web page with the questionnaire. The access to the questionnaire was straightforward and required only an internet browser. The questionnaire comprised 17 questions. Almost all questions where in a multiple choice format and respondents answered by just clicking on the choice that corresponded to their response. Some of the questions also had a small open-text box where respondents were enabled to specify in details other items not covered by the set of choices provided in the question. Participants were allowed to write general comments about the study. They could also request a copy of the results and in this case they had to provide an e-mail address. The survey was conducted for 2 weeks (Dec 2nd 2002 - Dec 15th 2002), during which 98 responses were received. After this time, the web page containing the questionnaire was replaced with a page indicating the end of the survey and providing the e-mail of the author. The questionnaire was structured across four major categories: User related questions, asking the type of involvement in on-line courses, the length of this involvement, and the size and type of the classes. Platform related questions, asking some information about the technological platforms used and the facilities provided by these platforms. Student and assessment related questions that aimed to identify what assessment techniques where utilised by the instructors and how the assessment information was used in their teaching activity. In addition, some questions addressed information about the students the instructors demanded. Feedback related questions included a couple of open text boxes where participants could provide comments and feedback and another one to type their e-mail address in case interested in receiving a summary of the results. In addition to the questionnaire, we conducted several structured discussions with distance teachers in Leeds to uncover aspects that had not been captured by the questionnaire. RESULTS ANALYSIS AND RECOMMENDATIONS The analysis here presents the key issues and findings extracted from the survey data. We had respondents from 11 different countries, and 78% of them were instructors involved in university courses. More than 83% of the respondents have experience of more that 1 year in on-line courses. We therefore consider that the survey involved a representative sample of potential users of our system. We ought to acknowledge though that the data from the survey may not be fully representative of the views of all instructors involved in on-line teaching, which is out of the scope of our work. The findings from this sample provide an interesting 3 International Forum of Educational Technology & Society (IFETS) is a subgroup of the IEEE Computer Society Learning Technology Task Force (LTTF), see http://lttf.ieee.org and http://ifets.ieee.org 4 The Global Educators' Network (GEN) is an international community of on-line educators. The main activity of GEN is to promote monthly on-line seminars on topic related to learning and teaching on-line. The Global Educators' Network can be found at http://vu.cs.sfu.ca/GEN/welcome/welcome.html 5 A copy of the questionnaire is accessible in http://telos.usilu.net/survey/questionnaire.html 5th International Conference on New Educational Environments. Lucerne 26-28 May. (ICNEE 2003). pp. 215 – 220. ISBN 3-0345-0096-3 range of responses that can be used to extract some trends, rather than being a definitive picture of all distance learning instructors. In line with the objectives of the study, the analysis here will consider three themes - social, cognitive and behaviour aspects which tutors are interested in. We will identify requirements of distance teachers related to each of these themes and will give some recommendations for the implementation of a tool for externalising appropriate information to instructors. Extremely interesting + Very interesting Interesting + Somewhat interesting Not at all interesting + I don't know Access to the course 54.35% Quiz and assignment grade 64.13% Participation in discussions 66.30% Posting e-mail to colleagues Participation in chat 32.61% Frequency of re-visiting of the same page 25.00% 28.26% Participation in group exercises 67.39% 34.78% 26.09% 22.83% 44.57% 36.96% 41.30% 20.65% 7.61% 8.70% 6.52% 18.48% 26.09% 27.17% 11.96% Table 1: Summary of information about students the respondents found interesting. Social aspects of the learners The main tools in an on-line course that engage 0% 20% 40% 60% 80% 100% students and instructors in communicative Content materials activities are discussion forums, e-mail and chat. Discussion forum E-mail The former two are used by more than 80% of Chat the respondents in the study, while chat is Shared whiteboard popular only with a half of them (Fig. 1). Group Glossary Calendar work is also an interesting opportunity for Student presentations Web based audio and/or students to cooperate together and socialise. video conference When the course is completely on-line, this Students home pages Other tool facility is crucial for the creation of a successful Figure 1: Facilities used on-line course. The group work is used by 62% of the respondents (Fig. 2). Recommendations: A tool that represents the students' social activities in the course should consider the data provided by the communication facilities included in that course. The participation in discussion is considered as the most interesting and valuable in the evaluation of both the course and the students' activities. Several respondents made interesting comments about the usefulness of the qualitative analysis of discussions, but dialogue analysis is laborious and, at the current state of research, is done mainly manually by humans. Our recommendation is that a quantitative visualization about discussions should be provided. The instructor can use this information as an indicative element to decide which parts of the interaction have to be analysed qualitatively to further understand certain social aspects in 0% 20% 40% 60% 80% 100% distance classes. Data from other Quiz test communication tools (e-mail and chat), Assignments although very common in on-line courses, is Group work rated with a low interest for the teaching Analysis of discussions in forums purposes (Tab. 1). We, therefore, believe that Usage statistics visualizing this data may not be that useful. The Analysis of log files participation in group work is also crucial for Other assessment methods the instructors and appropriate visualization of Figure 2: Assesm ent techniques and the data about this kind of activity should be tools used considered. Cognitive aspects of learners Unarguably, the most interesting aspect for instructors is the cognitive one. This is probably valid both in distance and in face-to-face education. Students enrol a course because they want to learn the concepts of the course. A good teacher has to check that this is accomplished 5th International Conference on New Educational Environments. Lucerne 26-28 May. (ICNEE 2003). pp. 215 – 220. ISBN 3-0345-0096-3 in their course, and, if not, to remedy by 0% 20% 40% 60% 80% 100% adjusting the teaching or adapting the To adapt teaching to individual or group material to the target of the class. of students Recommendations: It is highly To identify and remedy common misconceptions recommended to give a suitable external To set up optimal peer learning or representation of the students' tutoring groups performance in the course. The survey To respond to specific individuals in an indicated that the assessment techniques appropriate way typical for on-line courses (quiz, Other assignments and group work) were used by more than 62% of the respondents Figure 3: Usage of inform ation (Fig. 2). The participants in the questionnaire expressed a high interest in having information about the overall performance in the course (82%), the level of knowledge achieved by each student for each domain concept of the course (63%). The importance of this information was also stressed by participants in the discussions we had. Almost all instructors wanted to use this information in order to identify and remedy learners' common misconceptions in their courses (Fig. 3). A visualization system should provide instructors with a clear and immediate external representation of students having difficulties with a concept. Moreover, this representation should carry out a comparison of a student with the whole class, as confirmed by 62% of the respondents (Fig. 4). Behavioural aspects of learners Who doesn't remember our primary school teacher with their concerns about "improper" behaviour? (e.g. "you are always late at school", or "you have to stop talking to your classmate and try to follow the lesson"). Teachers tend to look at behavioural indicators and use them to judge the factors like active learning, motivation, engagement, and in general to assess the success or the failure of a course. With computer mediated communication some of these indicators are difficult to analyse, others are not relevant. We asked the participants in the survey about the various behavioural indicators distance teachers require. Interestingly, the majority of the respondents found as vital the information about the students' access to the course, participation in discussions and group exercises (Tab. 1). In addition, many instructors were interested in discovering students progressing slowly with the course schedule (Fig. 4). Recommendations: Highly needed information that should be represented externally in a course is the students' access to the course. Akin face-to-face teaching, poor course attendance is considered as a symptom 0% 10% 20% 30% 40% 50% 60% 70% of a possible problem with the learner. Students who are progressing too quickly Other information that should be with the course schedule Students who are progressing too slowly represented is the reading of course with the course schedule material (e.g. access and time spent), Students who do (or do not) accessing the course for certain period the performing of evaluation proofs Students who do (or do not) participate actively in discussions by posting messages and the participation in discussion. Students who do (or do not) participate Some instructors use these activities as passively in discussions by reading Students whose results in assessments are basis for judging the mandatory significantly different from the mean of the participation in the course6. Moreover, Other categories of students an indication about the students' progressing with the schedule of the Figure 4: Type of interesting students to m onitor course should be provided as well. 6 One of the respondent to the survey included the following comment: "20-30% of a student's grade is based on active, meaningful participation in asynchronous group discussion databases. If students do not earn 60% on this component, they fail the course“. 5th International Conference on New Educational Environments. Lucerne 26-28 May. (ICNEE 2003). pp. 215 – 220. ISBN 3-0345-0096-3 NEXT STEPS This survey gave some useful indications about what kind of information is required by distance teachers. Our next step is to exploit visualization techniques to present this information to instructors in an appropriate manner that facilitates the required understanding. A visualization tool - CourseVis - is being implemented to meet the recommendations drawn from the survey. The tool, which is out of the scope of this paper, extracts data from an online course maintained with WebCT (one of the most popular course management systems) transforms the data into xml format, and, at the present, visually represent some of the information needed by the teachers using 2D and 3D scatterplots and visualization techniques such as zooming, focusing, and panning. The advantages of CourseVis are: (a) tutors and students continue to use the CMS in the usual manner; (b) the information visualised complies with the instructors' requirement; and (c) the tool can be used independently from a CMS. CONCLUSIONS This study draws interesting indications of the type of information required by instructors teaching at distance by focusing on three themes: social, cognitive and behavioural aspects of the students. The results of the study elicited useful recommendations for the implementation of a graphic visualization tool, CourseVis, to support distance learning teachers. However, the findings of the survey can inform not only the design of this particular system, but also every application aimed at facilitating distance teachers. We are currently implementing CourseVis by utilising visualization techniques, and intend to conduct an empirical evaluation of the system in due course to examine its usefulness in distance learning. Acknowledgements. The authors are thankful to the participants in the study. The work was partly supported by a Swiss National Science Foundation fellowship of the first author. REFERENCES AFT - AMERICAN FEDERATION OF TEACHERS (2000), Distance Education Guidelines for Good Practice. http://www.aft.org/higher_ed/downloadable/distance.pdf BRUSILOVSKY, PETER (1999). Adaptive and Intelligent Technologies for Web-based Education. Künstiche Intelligenz, Special issue on Intelligent Systems and Teleteaching. HELIC, DENIS and MAURER, DENIS and SCHERBAKOV, DENIS (2000). Web Based Training: What do we Expect from the System, Proceedings of ICCE 2000, Taiwan. FLUECKIGER F. and MAZZA R. (2001) Open Distance Learning at Southern Switzerland Universities EUNIS 2001 - 7th International Conference of European University Information Systems, Berlin, Humboldt-University, March 28-30. GRATTO, K. (1999). Distance Education Best Practices and Problems, Report to the Distance Education Evaluation Task Force, North Carolina A & T State University. MAZZA, R. (2002). Using open student models in distance learning environments to help teachers provide adaptive tutoring. Submitted to Studies in Communication Sciences journal. REFFAY CHRISTOPHE AND CHANIER THIERRY (2002). Social Network Analysis Used for Modelling Collaboration in Distance Learning Groups. Proc. of ITS 2002, Biarritz. SCOTT, JOHN. (1991). Social Network Analysis: A Handbook. Sage Publications (CA) SPENCE ROBERT (2001). Information Visualisation. Addison-Wesley. SUTTON LEAH A. (2001). The Principle of Vicarious Interaction in Computer-Mediated Communications. International Journal of Educational Telecommunications, Vol. 7 N.3 TUFTE EDWARD R. (1990). Envisioning Information. Graphics Press, Cheshire, Connecticut, USA.
