Population - SOCIAL PLANNING COUNCIL of Ottawa
advertisement

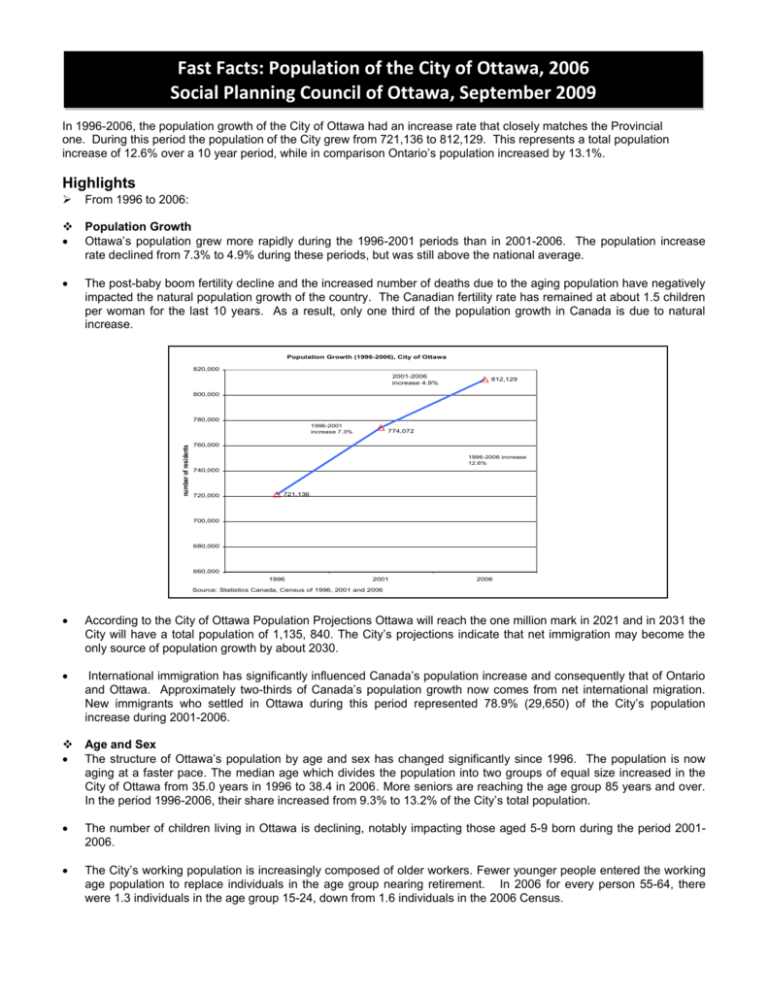
Fast Facts: Population of the City of Ottawa, 2006 Social Planning Council of Ottawa, September 2009 In 1996-2006, the population growth of the City of Ottawa had an increase rate that closely matches the Provincial one. During this period the population of the City grew from 721,136 to 812,129. This represents a total population increase of 12.6% over a 10 year period, while in comparison Ontario’s population increased by 13.1%. Highlights From 1996 to 2006: Population Growth Ottawa’s population grew more rapidly during the 1996-2001 periods than in 2001-2006. The population increase rate declined from 7.3% to 4.9% during these periods, but was still above the national average. The post-baby boom fertility decline and the increased number of deaths due to the aging population have negatively impacted the natural population growth of the country. The Canadian fertility rate has remained at about 1.5 children per woman for the last 10 years. As a result, only one third of the population growth in Canada is due to natural increase. Population Growth (1996-2006), City of Ottawa 820,000 2001-2006 increase 4.9% 812,129 800,000 780,000 number of residents 1996-2001 increase 7.3% 774,072 760,000 1996-2006 increase 12.6% 740,000 720,000 721,136 700,000 680,000 660,000 1996 2001 2006 Source: Statistics Canada, Census of 1996, 2001 and 2006 According to the City of Ottawa Population Projections Ottawa will reach the one million mark in 2021 and in 2031 the City will have a total population of 1,135, 840. The City’s projections indicate that net immigration may become the only source of population growth by about 2030. International immigration has significantly influenced Canada’s population increase and consequently that of Ontario and Ottawa. Approximately two-thirds of Canada’s population growth now comes from net international migration. New immigrants who settled in Ottawa during this period represented 78.9% (29,650) of the City’s population increase during 2001-2006. Age and Sex The structure of Ottawa’s population by age and sex has changed significantly since 1996. The population is now aging at a faster pace. The median age which divides the population into two groups of equal size increased in the City of Ottawa from 35.0 years in 1996 to 38.4 in 2006. More seniors are reaching the age group 85 years and over. In the period 1996-2006, their share increased from 9.3% to 13.2% of the City’s total population. The number of children living in Ottawa is declining, notably impacting those aged 5-9 born during the period 20012006. The City’s working population is increasingly composed of older workers. Fewer younger people entered the working age population to replace individuals in the age group nearing retirement. In 2006 for every person 55-64, there were 1.3 individuals in the age group 15-24, down from 1.6 individuals in the 2006 Census. Population Change by Age Group (1996-2006), City of Ottawa 78.43% 85+ 35.38% 75-84 12.24% 65-74 54.65% 55-64 30.01% Age Groups 45-54 3.52% 35-44 25-34 -10.54% 15.10% 20-24 23.73% 15-19 11.62% 10-14 5-9 0-4 -20.00% -5.89% %increase %decrease -6.62% -10.00% 0.00% 10.00% 20.00% 30.00% 40.00% 50.00% 60.00% 70.00% 80.00% 90.00% % change Source: Statistics Canada, Census of 1996 and 2006 . Ottawa’s Population Pyramid Population trends and age structure have shaped Ottawa’s population pyramid as a column-like structure with a bulking middle. This shape reflects a society with lower births, a shrinking number of children, and an increasing older population. The size of Ottawa’s 25-34 years old age group declined significantly over 1996-2006 due to baby boomers’ exit from this age group. Population Pyramide (2001-2006), City of Ottawa 85+ Male 80-84 Female 75-79 70-74 65-69 60-64 Age Groups 55-59 50-54 Female 2006 Female 2001 Male 2006 Male 2001 45-49 40-44 35-39 30-34 25-29 20-24 15-19 10-14 5-9 0-4 5 4 3 2 Source: Statistics Canada, Census of 2001 and 2006 1 0 1 2 3 4 5 Population (%) Ottawa Female: Male Ratio Women outnumber men in the City of Ottawa, an overall Ottawa ratio of 107 women for every 100 men. However, the female:male ratio increases in the cohorts of the senior population, as women live longer than men. For additional information on this topic please see This is Who We Are: A Social Profile of the City of Ottawa, Based on the 2006 Census, Publications 2008, Social Planning Council of Ottawa www.spcottawa.on.ca


