(Ites) Industry In India - Association for Business and Economics
advertisement
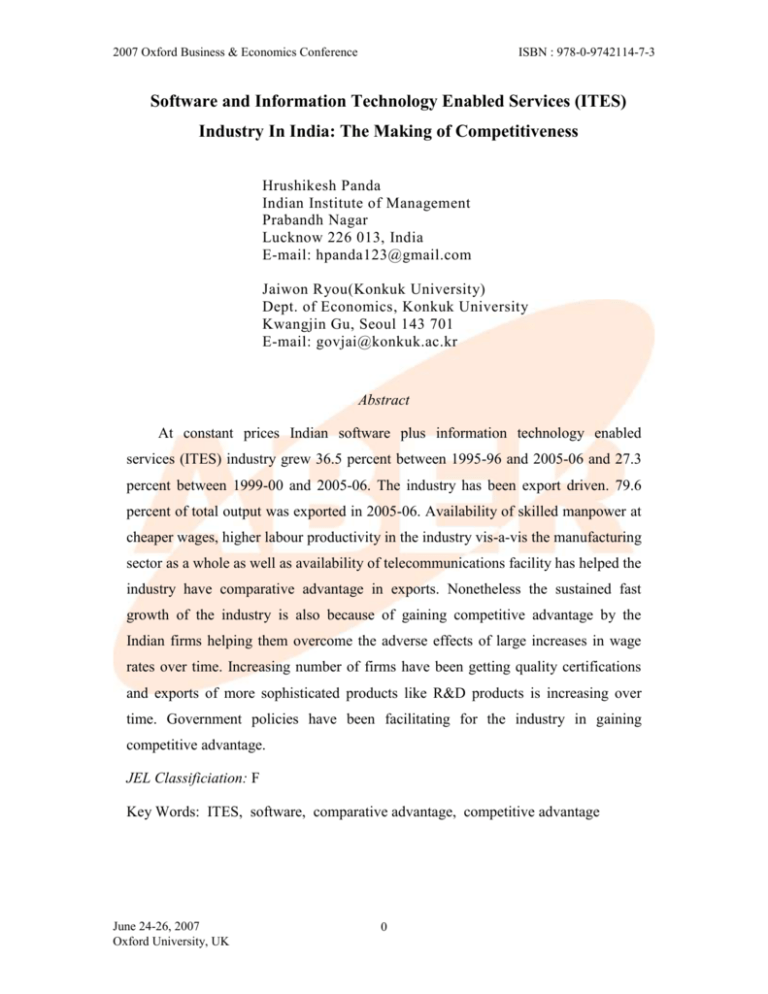
2007 Oxford Business & Economics Conference ISBN : 978-0-9742114-7-3 Software and Information Technology Enabled Services (ITES) Industry In India: The Making of Competitiveness Hrushikesh Panda Indian Institute of Management Prabandh Nagar Lucknow 226 013, India E-mail: hpanda123@gmail.com Jaiwon Ryou(Konkuk University) Dept. of Economics, Konkuk University Kwangjin Gu, Seoul 143 701 E-mail: govjai@konkuk.ac.kr Abstract At constant prices Indian software plus information technology enabled services (ITES) industry grew 36.5 percent between 1995-96 and 2005-06 and 27.3 percent between 1999-00 and 2005-06. The industry has been export driven. 79.6 percent of total output was exported in 2005-06. Availability of skilled manpower at cheaper wages, higher labour productivity in the industry vis-a-vis the manufacturing sector as a whole as well as availability of telecommunications facility has helped the industry have comparative advantage in exports. Nonetheless the sustained fast growth of the industry is also because of gaining competitive advantage by the Indian firms helping them overcome the adverse effects of large increases in wage rates over time. Increasing number of firms have been getting quality certifications and exports of more sophisticated products like R&D products is increasing over time. Government policies have been facilitating for the industry in gaining competitive advantage. JEL Classificiation: F Key Words: ITES, software, comparative advantage, competitive advantage June 24-26, 2007 Oxford University, UK 0 2007 Oxford Business & Economics Conference ISBN : 978-0-9742114-7-3 Introduction Indian software plus information technology enabled services (ITES) industry has grown at a fast pace during the last two decades. Of the fast growing Indian economy software and ITES output accounted for 3.61 percent of GDP during 200405 increasing from 1.41 percent during 1999-20001. Much of this growth has come from exports. 79.6 percent of total software and ITES output were exported during 1 2005-062. Wages in India are quite low in comparison to wages in developed countries. India also has a relatively large supply of English speaking human capital that can be used for software, ITES and other skilled intensive industries. It is thus natural to think that it is comparative advantage (availability of a resource at lower prices) that led and leads to growth of exports and thereby total output of software and ITES products in India. In the present study, however, we argue that it is not simply lower wages and greater availability of skilled labor, but government policies that are conducive for growth of exports as well as greater dynamism on the part of Indian firms in bringing about growth of productivity, product diversification and improving product quality that have been equally responsible and becoming increasingly responsible for growth of the software and ITES industry in India. In Section I we discuss the performance of the industry with respect to growth of exports, output and employment. In Section II, we discuss the resource availability and comparative advantage that Indian software and ITES industry enjoys. In Section III we discuss the policy environment and technology dynamism of the Indian firms leading to competitive advantage and facilitating growth of the industry. Section IV contains a summary of the main findings. Unless otherwise mentioned data have been obtained from the website of National Association of Software and Service http://www.nasscom.org/artdisplay.asp? 1. Financial year in India is from April 1 to March 31. 2. These figures are given in Tables 1 and 4 below. June 24-26, 2007 Oxford University, UK 1 Companies (Nasscom): 2007 Oxford Business & Economics Conference ISBN : 978-0-9742114-7-3 II. Performance Software industry constitutes core services like information technology (IT) outsourcing; Support and training; R&D services and software products which include Product development, design and development of embedded systems; Sales of packaged/ proprietary software. Some of the key ITES services lines are: Customer care; Web sales/marketing; Billing services; Database marketing; Accounting ; Transaction document management; Transcription; Telesales/telemarketing; Benefits administration; Tax processing; HR hiring/administration; Biotech research. At current prices software plus ITES output increased from 1.224 billion US dollars in 1995-96 to 5.662 billion US dollars in 1999-00 and to 29.4 billion US dollars in 2005-06 (Table 1 and Figure 1). Average annual rate of growth was 37.9 percent for the period 1995-96 to 2005-06 and was 32.0 percent from 2000-01 to 2005-06 (Table 3). At constant (1993-94) prices software plus ITES output was 30.8 billion Indian rupees in 1995-96, 157.1 billion Indian rupees in 1999-2000 and 658.2 billion Indian rupees in 2005-06 (Table 2), average annual rate of growth being 36.5 percent between 1995-96 and 2005-06 and 27.3 percent between 1999-00 and 200506 (Table 3). ITES industry has been a more recent phenomenon. However, output of ITES has been growing at a faster pace than that of software. Share of software in total software plus ITES output has been large, but that of ITES has been growing over time. Output of software at constant prices increased from 140.5 to 476.8 billion Indian rupees between 1999-00 and 2005-06. That of ITES increased from 16.6 to 181.3 billion Indian rupees during the same period. Consequently the share of ITES in total software plus ITES output increased from 10.6 to 27.6 percent between 199900 and 2005-06. Average annual rate of growth output at constant (1993-94) prices between 1999-2000 and 2005-06 was 23.2 percent for software and 49.5 percent for ITES. As a result of the fast rate of growth, share of software plus ITES industry in GDP increased from 1.41 to 3.61 percent between 1999-00 and 2005-06 (Figure 2). The software and ITES industry in India has been basically export driven and share of export in total output has been increasing over time. In 1995-96, 60.0 June 24-26, 2007 Oxford University, UK 2 2007 Oxford Business & Economics Conference ISBN : 978-0-9742114-7-3 percent of software plus ITES output was exported; the share increased to 70.0 percent and 79.6 percent in 1999-00 and 2005-06 respectively (Table 4). So far most of ITES output have been for the export market. About 90 percent or more of ITES output has been exported over the years. Share of exports in output of software which was 66.4 percent in 1999-00 also increased to 75.6 percent in 2005-06. Share of ITES in exports of software plus ITES increased from 15.1 to 31.2 percent during the same period. The increasing share of exports in total output has meant that exports have grown faster than total output. At current prices software plus ITES exports were 0.734, 3.962 and 23.400 billion US dollars respectively in 1995-96, 1999-00 and 2005-06 (Table 4). At constant prices the figures were respectively 18.5, 109.9 and 523.9 billion Indian rupees respectively (Table 5). Average annual rate of growth of exports of software plus ITES between 1995-96 and 2005-06 was 42.0 at current prices and 40.7 percent at constant prices. That between 1999-00 and 2005-06 at current and constant prices was 30.8 and 26.3 percent respectively for software and 52.0 and 46.9 percent respectively for ITES (Table 3). North America and Europe remained key export markets, contributing around 69 percent and 23 percent, respectively to overall IT-ITES export revenue during 2003-04. There was also an equally fast increase in the number of knowledge professionals employed by the software plus ITES industry. There was only a marginal increase in the number of knowledge professionals employed from 156 thousand to 160 thousand between 1990-91 and 1995-96. Thereafter there was a fast increase to 284 thousand in 1999-2000 and 813 thousand in 2003-04 (Table 6). (Simple) average annual rate of growth between 1995-96 and 1999-00 stood at 19.4 percent. Average annual rate of growth between 1999-00 and 2003-04 was 30.6 percent. III. Resource Availability and Comparative Advantage Important inputs in the industry are trained manpower, supply of IT equipment like computers, telecommunication facilities and electricity. Supply of electricity has June 24-26, 2007 Oxford University, UK 3 2007 Oxford Business & Economics Conference ISBN : 978-0-9742114-7-3 been poor in India demand outstripping supply in most states. However many firms generate their own electricity. Thus, even though self-generated electricity could be costlier, availability of electricity would not hinder growth in a not so electricityintensive industry like software plus ITES industry. Imports of computers especially for an export industry like software plus ITES has been easy and on lower tariff rates. Given economies of scale and fast technological progress in production of computers, importing computers than depending on a domestic industry would add to the comparative advantage of the software plus ITES industry especially during the 1980s and 1990s when the overall demand for computers was low in India. We therefore examine only the extent of availability of telecommunication facilities and professional manpower in India over time. Arrora and Athreye (2002) have carried out a study to derive comparative advantage in India vis-à-vis competing countries by comparing wage rates and the ratio of labour productivity in software industry to that of manufacturing sector as a whole for the year 1995. We discuss the main findings of this study. We believe that India’s comparative advantage in software production observed by the authors would not change much during later years. Availability of Telecommunication Facilities: Availability of telecommunication facilities in India has been quite low in absolute sense as well as in comparison to the equally large and fast growing developing country China (Table 7). For instance, in year 2003 density of fixed telephones per 100 population has been 3.9 in India in comparison to 18.0 in China. That of mobile telephones has been 2.6 in India in comparison to 18.3 in China. Rate of growth of telecommunications facilities in India, however, has been over 22 percent since the mid-nineties (Table 8). Much of this growth in the 2000s has been because of growth of the mobile segment. Ratio of mobile to fixed telephones increased from 0.07 to 1.11 between 2000 and 2004. Cost of telecommunications have also been very low and are declining over time. Thus increase in telecom revenue has been very low in comparison to the increase in number of telecom subscribers coupled with a plausible increase in the intensity of use per connection. Between 1999 and 2003 average annual increase in number of subscribers was 32.9 percent whereas that in revenue was only 6.9 percent (Table 9). June 24-26, 2007 Oxford University, UK 4 2007 Oxford Business & Economics Conference ISBN : 978-0-9742114-7-3 Fast growth of telecommunications facilities available at lower prices over time clearly helped in the growth of the software and ITES industry which has spread from big cities to smaller ones. Manpower Availability: As seen from rows 7 and 9 of Table 10 India’s labor supply is quite adequate in spite of the IT companies complaining of inadequate supply and higher attrition rates. In comparison to an overall employment of 813 thousand professionals in year 2003-04, total trained professionals in year 2004-05 was 679 thousand of which about 373 thousand were engineering graduates. Not all engineering graduates would join the software plus ITES industry, but the large yearly turnover of trained manpower would suggest that growth of software plus ITES industry would not suffer because of inadequate supply of trained manpower. Moreover, India has a large pool of unemployed/underemployed science graduates. They can be easily trained to join especially the ITES -business process outsourcing industry. Thus availability of adequate supply of professional labor has been a major reason behind growth of IT industry and labor supply is not going to be a major constraint for growth of the industry in the foreseeable future either. Given demand and availability of unemployed graduates, private training institutions/universities and firms themselves would train to make them employable in the industry. Comparative Advantage: As Arora and Athreye (2002) observe wage rates of IT professionals in India is very low in comparison to those in advanced countries. For instance, in 1995 compared to a wage of 74 thousand US dollars in Switzerland, 54 thousand in US and 39 thousand in UK for project leader, the same was only 23 thousand in India. At the lower end of test engineer, the figures were respectively 59, 42, 24 and 8 thousand. (Table 11). Quality of Indian professionals and thereby labour productivity in India are no way worse than those in other countries. India would thus enjoy absolute advantage in exports of software industry. Trade, however, takes place according to comparative advantage. The authors show that India has comparative advantage vis-à-vis many other countries in export of software. June 24-26, 2007 Oxford University, UK 5 2007 Oxford Business & Economics Conference ISBN : 978-0-9742114-7-3 Excluding Israel, productivity in IT sector as a multiple of total manufacturing productivity is much higher at 2.18 in India in comparison to 2.09 in France, 1.28 in US, 1.22 in Ireland and 1.10 in Finland (Table 12, last column). IV. Enabling Policy Environment and Technological Dynamism of Firms Leading to Competitive Advantage Enabling Policy Environment: What policies government follows is important for an industry to come up. Government policies in India have been very supportive from the beginning towards software and ITES industry. Even before the process of liberalization commenced since 1991, imports of equipments for the software sector (namely computers) were liberalized in the 1980s as these imports were used for an export activity software sector. Rates of import duties were set low even during the 1980s3. A private MNC firm Texas Instrument was allowed to install its own telecom facilities to be used for export of software (Patibandla and Petersen 2002). Till 1994, Department of Telecommunications (DOT) was the sole provider of basic telecom services in India. Slowly there have been liberalizations in this sector. Corporatization of state run telecom services under DOT has taken place. Public sector enterprises like BSNL and VSNL were set up for the purpose. VSNL has been subsequently sold to private sector. The New National Telecom Policy 1999 opened the field for private participants. International long distance, national long distance and basic telephone services have been opened up for free competition. Internet service providers (ISPs) have come up in the private sector. They have been allowed to set up their own international gateways and submarine cable landing stations. Internet telephony has been permitted. Revenue sharing has been introduced between service providers. According to DOT estimates, the total private investments in the 3. Economic Survey, Government of India, New Delhi for 1980s and 1990s enumerate some of these policies. June 24-26, 2007 Oxford University, UK 6 2007 Oxford Business & Economics Conference ISBN : 978-0-9742114-7-3 telecom sector have been of the order of Rupees 306,160 million (US$ 6714 million). The FDI inflow into this market has been around Rupees 85,913 million (till 200203). The IT Bill passed in 2000 provides a legal framework for the recognition of electronic contracts, prevention of computer crimes, electronic filing of documents, etc. Government has freely allowed MNC investment in India as well as Indian firms to invest abroad and raise capital abroad. This has greatly helped developing facilities in India as well as developing market synergies abroad. Government has established Software Technology Parks in many cities starting with the one at Bangalore. There are 47 technology parks by year 2005. Nasscom reports “The last five years has seen a tremendous growth in Tech Parks that are geared to meet the requirements of the knowledge industry. Located in key IT and ITES markets like Chennai, Bangalore and Gurgaon, these parks offer Silicon Valley type infrastructure ...right here in India. Multi-tenanted intelligent buildings, built-tosuit facilities, large sprawling campuses...the choices are tailor made to customer requirements”. Differently from the traditional labor-intensive industries, software and ITES industry is characterized by scale economies at the industry level resulting from positive external economies attained by firms. Having a cluster of firms in technology parks has helped the firms in gaining competitive advantage by attaining positive external economies in the form of specialized suppliers, labor market pooling, and knowledge spillovers as analysed by Alfred Marshall (Krugman and Obstfeld 2006, Chapter 6). Recognizing the importance of venture capital funding, the Ministry of Information Technology has set up a National Venture Fund for the software and IT industry with a corpus of Rupees 10 billion in association with the Small Industries Development Bank of India (SIDBI) and Industrial Development Bank of India (IDBI). The aim of the fund is to provide venture capital to start up software professionals and IT units in the small-scale sector. June 24-26, 2007 Oxford University, UK 7 2007 Oxford Business & Economics Conference ISBN : 978-0-9742114-7-3 Government also has undertaken special initiatives to increase the information technology workforce in India. Since 1998 Government of India has set up the Indian Institute of Information Technology (IIIT) in many places. IIITs have been set up in cities like Allahabad, Bangalore, Gwalior, Hyderabad, Kolkata, and Pune. More are in the process of being set up in places like Mohali (Chandigarh) and Jabalpur. Technological Dynamism of Firms: Growth of Indian software plus ITES industry has been much faster than that of the world software plus ITES industry. In comparison to the Indian industry’s rate of growth of output and exports of over 30 percent per annum during the last half decade or so, world industry growth rate has been modest. It was about 6 percent in 2004. The high rate of growth of the Indian industry has been sustained over last two decades. Had it been only because of comparative advantage, growth would not be so high for so long. The sustained growth of overall output and exports for over two decades would suggest that Indian firms have secured competitive advantage in capturing a larger share of the world market. Indian software industry accounts for a low two percent share of world software industry. Thus there are large possibilities of growth of output from exports. Certainly this factor has helped growth of exports and thereby output of Indian software industry. Nonetheless Indian export industry is large in comparison to other top exporting countries like Canada, Ireland, Israel, Philippines and South Africa accounting for 56.4 percent of total exports from these countries in the year 2003-04 (Table 13). Exports from India growing at a fast pace in spite of accounting for a large proportion total exports from competing countries would clearly hint at competitive advantage gained by Indian firms. Competitive advantage gained by Indian firms possibly would not have been only because of internal economies of scale attained in production by firms. In 200304, top 5 firms with a revenue of more than 10 billion Rupees accounted for 32 percent of total revenue in the industry (Table 14). Middle level firms with revenue June 24-26, 2007 Oxford University, UK 8 2007 Oxford Business & Economics Conference ISBN : 978-0-9742114-7-3 between 1 to 10 billion Rupees accounted for 24 percent and small firms with revenue of less than 1 billion Rupees accounted for 14 percent of total revenue in the industry. MNC backend firms, which are not exactly large firms, accounted for 26 percent of total industry revenue. In 2005 there were about 3000 IT (software plus ITES as well as hardware) producing firms in India. Between 2003-04 and 2004-05 number of ITES firms increased from 285 to 410. This would indicate that competitive advantage may not necessarily be because of economies of scale in production. When firms are improving their competitiveness in the market, it is to be expected that their levels of productivity would increase. For software industry there was no change in revenue at current prices per knowledge professional employed (Table 15). For ITES industry there was an increase in this variable from 14286 US dollar per annum to 16667 US dollars per annum between 1999-2000 and 2004-05. There was a decline in annual revenue at constant (1993-94) prices per knowledge professional employed for software industry from 580449 to 543463 rupees between 1999-2000 and 2003-04. For ITES industry it more or less did not change much. It increased somewhat from 396424 rupees in 1999-00 to 419838 in 2003-04, then it declined to 399466 rupees in 2004-05. The decline in revenue per knowledge professional employed – an indicator of labour productivity – however need not imply that the industry became less competitive over time for the following reasons. Though export share in total output is increasing, domestic market is also increasing over time in absolute term. The increase in software plus ITES output for the domestic market at constant prices increased at an average annual rate of 27.4 percent between 1995-96 and 2005-06 (Table 3). Production for domestic market is plausibly less skill and more labour intensive. This then pulls down the overall labour productivity in the industry. The industry has seen fast growth in the wage rate over time. Nasscom study shows that between 2002 and 2003 increase in wage rate was 23.6 percent for software engineer and was as high as 58.4 percent for head-software development/large business unit (Table 16). In other years rate of increase in wages June 24-26, 2007 Oxford University, UK 9 2007 Oxford Business & Economics Conference ISBN : 978-0-9742114-7-3 might not be so high. Nonetheless there would be large increase in the wage rate over time. Indian software plus ITES industry achieving a fast rate of growth of exports in the face of large increases in the wage rate would clearly indicate technological dynamism improving labour productivity by the Indian firms thereby gaining competitive advantage in the market. Because of technological dynamism and large increases in wage rates, many Indian software professionals working abroad are returning back to India. Chumki Bharadwaj and Himalee Bahl (2005) write “Recently released NASSCOM figures state that 25,000 Indian IT workers returned home between 2001 and 2004. The average number of returning prodigals has increased from about 7,000 in 2001 to about 10,000 in 2004.Of the relocating population, 10-15 per cent returns are from the US, with Japan and 4South-East Asia being next in line”. : 18 July 2005, Outlook Money. Technological dynamism by Indian software plus ITES firms leading to competitive advantage also comes out from the fact that Indian firms have increasingly been producing more skill intensive sophisticated products and are obtaining quality certifications. Software product development and R&D offsoring for embedded systems exports increased from 1.67 billion US dollars in 2002-03 to 2.31 and 3.00 billion US dollars respectively in 2003-04 and 2004-05 with an average annual rate of growth of 34.1 percent (Table 17). Number of Fortune 500 companies serviced increased by 33.3 percent from 300 to 400 between 2003-04 and 2004-05. Chumki Bharadwaj and Himalee Bahl (2005). By March 2002, 42 companies had obtained SEI CMM (Capability Maturity Model) Level assessment. The number increased to 65 firms by December 2003. 275 Indian software and ITES-BPO companies acquired quality certifications and about 80 more companies are in the pipeline during this time. Many leading ITES 4. R&D offsoring is done by MNCS. But Indian firms are also engaging in the same. There were 230 MNC R&D offsoring units and 100 domestic firms engaged in producing R&D products in 2005. Appendix Table gives the list of some top MNC R&D offsoring units in India. June 24-26, 2007 Oxford University, UK 10 2007 Oxford Business & Economics Conference companies have received ISBN : 978-0-9742114-7-3 quality certifications such as COPC (http://www.nasscom.org/artdisplay.asp?cat_id=37). IV. Summary At constant (1993-94) prices Indian software plus information technology enabled services (ITES) industry grew at the rate of 36.5 percent between 1995-96 and 2005-06 and 27.3 percent between 1999-00 and 2005-06. Starting at a relatively later date, ITES industry has been growing at a faster pace than that of software. Consequently the share of ITES in total software plus ITES output increased from 10.6 to 27.6 percent between 1999-00 and 2005-06. As a result of the fast rate of growth, share of software plus ITES industry in GDP increased from 1.41 to 3.61 percent between 1999-00 and 2004-05. The software and ITES industry in India has been basically export driven and share of export in total output has been increasing over time. 79.6 percent of total output was exported in 2005-06. There was also an equally fast increase in the number of knowledge professionals employed by the software plus ITES industry. Number of knowledge professionals employed increased from 160 thousand in 199596 to 813 thousand in 2003-04. Indian wages for software professionals are low in comparison to those in other countries like Switzerland, USA, Canada, UK, Ireland and Greece. On the other hand, labour productivity in software industry relative to the same for manufacturing sector as a whole is higher in India. Thus India has a comparative advantage in production of software. So would be the case for ITES. India is also endowed with an increasing availability of skilled manpower adding to its comparative advantage. Availability of the other crucial input for software plus ITES, telecommunications facility has grown at a fast pace over time. This paper argues that comparative advantage has helped the software plus ITES industry to grow. Nonetheless the sustained fast growth of the industry over time is also because of gaining competitive advantage by the Indian firms. Gaining June 24-26, 2007 Oxford University, UK 11 2007 Oxford Business & Economics Conference ISBN : 978-0-9742114-7-3 competitive advantage has helped the firms overcome the adverse effects of large increases in wage rates and keep the momentum of growth of exports over time. The fact that firms gained competitive advantage comes out from the fact that an increasing number of firms have been getting quality certifications and exports of more sophisticated products like software products and R&D product for embedded system is increasing over time. Attaining economies of scale in production, however, might not have been particularly important in firms gaining competitive advantage. Government policies with respect to import of hardware, setting up telecommunication facilities and technology parks have been highly facilitating for the industry in getting competitive advantage. June 24-26, 2007 Oxford University, UK 12 2007 Oxford Business & Economics Conference ISBN : 978-0-9742114-7-3 References Arora, Ashish and Athreyeb, Suma (2002) “The software industry and India’s economic development”, Information Economics and Policy Vol. 14, pp.253–273. Krugman, Paul R. and Obstfeld, Maurice (2006), International Economics, 7th ed. Addison-Wesley Publishing Company. Mani, Sunil (2005). The Dragon vs the Elephant: Comparative Analysis of Innovation Capability in the Telecom Industry of China and India. Economic and Political Weekly , September 24, 2005, pp 4271-4283. Patibandla, Murali and Petersen, Bent (2002). Role of Transnational Corporations in the Evolution of a High-Tech Industry: The Case of India’s Software Industry. World Development, Vol. 30, No. 9, pp.1561–1577. Sources of Data Source: http://www.indianembassy.org/indiainfo/india_it.htm (Original: Nasscom Report). http://www.nasscom.org/artdisplay.asp? 06.pdf http://www.mit.gov.in/annualreport2005- Chumki Bharadwaj and Himalee Bahl (2005). Write up in Outlook Money 18 July 2005. Quoted in http://www.nasscom.org/artdisplay.asp? Economic and Political Weekly, Current Statistics, April 15, 2006. Economic Survey, 2005-06. Government of India, New Delhi. June 24-26, 2007 Oxford University, UK 13 2007 Oxford Business & Economics Conference ISBN : 978-0-9742114-7-3 Table 1: Software and ITES Output at Current Prices Billion US Dollars -----------------------------------------------------------------------------------------------------------Software ITES Software+ Software+ITES Output Output ITES Output Output as % of GDP -----------------------------------------------------------------------------------------------------------1991-92 0.150 1995-96 1.224 1996-97 1.755 1997-98 2.670 1998-99 3.900 1999-00 5.062 0.600 5.662 1.41 2000-01 7.378 0.900 8.278 1.98 2001-02 8.425 1.500 9.925 2.28 2002-03 10.136 2.700 12.836 2.66 2003-04 11.704 3.900 15.604 2.95 2004-05 16.699 5.800 22.499 3.61 2005-06 21.300 8.100 29.400 ------------------------------------------------------------------------------------------------------Source:http://www.indianembassy.org/indiainfo/india_it.htm (Original: Nasscom Report) for figures up to 2000-01. http://www.nasscom.org/artdisplay.asp? for figures on ITES industry. http://www.mit.gov.in/annualreport2005-06.pdf for figures from 2001-02. Economic and Political Weekly April 15, 2006 Current Statistics, for figures on GDP. Note: Initially domestic market in ITES industry has been negligible. Thus output of ITES for years 1999-00 and 2000-01 have been considered same as exports. June 24-26, 2007 Oxford University, UK 14 2007 Oxford Business & Economics Conference ISBN : 978-0-9742114-7-3 Table 2: Software and ITES Output at Constant (1993-94) Prices Output in billion Indian Rupees -------------------------------------------------------------------------------------------------Output level Annual Growth rate % --------------------------------------------------------------Exchange WPI Software ITES Software Software ITES Software Rupees/$ 93-94 plus ITES plus ITES =100 ----------------------------------------------------------------------------------------------------------1995-96 31.50 125 30.8 1996-97 35.45 136 45.8 48.3 1997-98 37.12 142 69.8 52.6 1998-99 42.08 153 107.3 53.7 1999-00 44.12 159 140.5 16.6 157.1 46.5 2000-01 45.60 162 207.7 25.3 233.0 47.9 52.2 48.3 2001-02 47.73 168 239.4 42.6 282.0 15.3 68.2 21.0 2002-03 46.35 178 264.0 70.3 334.3 10.3 65.0 18.5 2003-04 47.74 181 308.7 102.9 411.5 16.9 46.3 23.1 2004-05 45.30 189 400.2 139.0 539.3 29.7 35.1 31.0 2005-06 44.10 197 476.8 181.3 658.2 19.1 30.4 22.1 --------------------------------------------------------------------------------------------------------Source: Figures on exchange rate have been obtained from http://www.nasscom.org/artdisplay.asp? and http://www.mit.gov.in/annualreport2005-06.pdf by dividing export figures given in rupee and dollar terms. Figures on WPI (wholesale price index) are obtained from Economic Survey, Government of India:2005-06 Table 3: Average Annual Growth Rate in Output, Exports and Domestic Market ---------------------------------------------------------------------------------------------------------------Industry Period Output Exports Domestic market ---------------------------------------------------------------------------------------------------------------Software at current prices 1999-00 to 2005-06 27.7 30.8 20.7 Software at constant (1993-94) 1999-00 to 2005-06 23.2 26.3 16.4 prices ITES at current prices ITES at constant (1993-94) prices 1999-00 to 2005-06 1999-00 to 2005-06 54.9 49.5 52.0 46.9 Software plus ITES at current prices 1999-00 to 2005-06 Software plus ITES at constant 1999-00 to 2005-06 (1993-94) prices 32.0 27.3 35.0 30.3 23.7 19.2 Software plus ITES at current prices 1995-96 to 2005-06 Software plus ITES at constant 1995-96 to 2005-06 (1993-94) prices 37.9 36.5 42.0 40.7 28.8 27.4 Software+ITES exports as % of Output 1995-96 to 2005-06 2.9 ------------------------------------------------------------------------------------------------------------ June 24-26, 2007 Oxford University, UK 15 2007 Oxford Business & Economics Conference ISBN : 978-0-9742114-7-3 Table 4: Software and ITES Exports at Current Prices Exports in billion US dollar -------------------------------------------------------------------------------------------------Software ITES Software Soft+ITES ITES exports as % plus ITES Exports as Software+ITES % of Output exports --------------------------------------------------------------------------------------------------1995-96 0.734 60.0 1996-97 1.085 61.8 1997-98 1.750 65.5 1998-99 2.650 67.9 3.962 70.0 15.1 1999-00 3.362 0.600 2000-01 5.317 0.900 6.217 75.1 14.5 2001-02 6.147 1.500 7.647 77.0 19.6 2002-03 7.445 2.500 9.945 77.5 25.1 2003-04 8.600 3.600 12.200 78.2 29.5 2004-05 12.500 5.200 17.700 78.7 29.4 2005-06 16.100 7.300 23.400 79.6 31.2 ------------------------------------------------------------------------------------------------Source: Same as in Table 1. Table 5: Software and ITES Exports at Constant (1993-94) Prices Exports in billion Rupees ------------------------------------------------------------------------------------------------Export level Annual growth rate in % Software ITES Software Software ITES Software plus ITES plus ITES ------------------------------------------------------------------------------------------------------1995-96 18.5 1996-97 28.3 52.9 1997-98 45.8 61.7 1998-99 72.9 59.3 50.9 1999-00 93.3 16.6 109.9 2000-01 149.7 25.3 175.0 60.4 52.2 59.2 2001-02 174.6 42.6 217.3 16.7 68.2 24.1 2002-03 193.9 65.1 259.0 11.0 52.8 19.2 2003-04 226.8 94.9 321.8 17.0 45.8 24.2 2004-05 299.6 124.6 424.2 32.1 31.3 31.8 2005-06 360.4 163.4 523.9 20.3 31.1 23.5 -------------------------------------------------------------------------------------------------------June 24-26, 2007 Oxford University, UK 16 2007 Oxford Business & Economics Conference ISBN : 978-0-9742114-7-3 Table 6: Number of Knowledge Professionals Employed In thousand ----------------------------------------------------------------------------------------------Software ITES Total Annual % Growth of Total -----------------------------------------------------------------------------------------------1995-96 160 1999-00 242 42 284 19.4 2000-01 360 70 430 51.4 2001-02 416 106 522 28.4 2002-03 490 171 661 19.8 2003-04 568 245 813 23.0 2004-05 348 Average 30.6 ---------------------------------------------------------------------------------------- Source : http://www.nasscom.org/artdisplay.asp? Note: Simple annual growth rate between 1995-96 and 1990-00. Table 7: Broad Features of the Telecommunications Sector in China and India (2003) -----------------------------------------------------------------------------------------China India Density of fixed telephones per 100 population 18.0 3.9 Density of mobile telephones per 100 population 18.3 2.6 2.5 0.4 Density of internet users per 100 population Density of broadband connections per 100 population 1.4 Charges for 20 hours of internet users per month (US $) 10.00 0.019 9.00 ------------------------------------------------------------------------------------------Source: Mani (2005) June 24-26, 2007 Oxford University, UK 17 2007 Oxford Business & Economics Conference ISBN : 978-0-9742114-7-3 Table 8: Growth of Telecommunications Services in India, 1990-2004 Number of subscribers in millions -----------------------------------------------------------------------------------Fixed Mobile Total %Change Ratio of Fixed to Mobile ------------------------------------------------------------------------------------1990 2.15 2.15 1991 5.07 5.07 135.8 1992 5.81 5.81 14.6 1993 6.80 6.80 17.0 1994 8.03 8.03 18.1 1995 9.80 9.80 22.0 1996 11.98 11.98 22.2 1997 14.54 0.34 14.88 24.2 0.02 1998 17.80 0.88 18.68 25.5 0.05 1999 21.59 1.20 22.79 22.0 0.06 2000 26.51 1.88 28.39 24.6 0.07 2001 32.44 3.58 36.02 26.9 0.11 2002 41.48 13.00 54.48 51.2 0.31 2003 42.58 33.58 76.16 39.8 0.79 2004 45.00 50.00 95.00 25.7 1.11 ----------------------------------------------------------------------------------Source: Mani (2005). Table 9: Telecoms’ Revenues in India 1997-200 -----------------------------------------------------------------------------Value in % Change in % Change in billion US $ Revenue No. of Subscribers -----------------------------------------------------------------------------1998 6.3 1999 6.5 3.2 22.0 2000 7.1 9.2 24.6 2001 7.6 7.0 26.9 2002 8.2 7.9 51.2 2003 8.8 7.3 39.8 -----------------------------------------------------------------------Source: Mani (2005) June 24-26, 2007 Oxford University, UK 18 2007 Oxford Business & Economics Conference ISBN : 978-0-9742114-7-3 Table 10: Availability of Knowledge Professionals in India --------------------------------------------------------------------------------------------------Category 2000-01 2001-02 2002-03 2003-04 2004-05 --------------------------------------------------------------------------------------------------1.IT Professionals from degree & diploma colleges 74,364 90,867 99,959 110,495 115,533 2. Non-IT Professionals from degree & diploma colleges 32,025 35,612 38,423 43,261 55,877 3. IT labour from non-engineering fields 26,597 31,620 38,439 42,853 4. New IT labor (1)+(2)+(3) 132,986 158,099 34,595 172,977 5.Total number of Engineering seats 290,088 333,094 361,076 192,194 214,263 401,791 464,743 6. IT Professionals from degree & diploma colleges as a percentage of Engineering seats 26 27 28 28 25 7. Engineering graduates 225345 259620 285597 8. IT graduates as a proportion of Engineering Graduates 33 35 35 315700 35 372687 31 9. New IT Labour and Engineering graduates (4)+(7) 358331 417719 458574 507894 679006 ----------------------------------------------------------------------------------------Entries on Row 7 is calculated by us as entry in Row 1/ Entry in Row 8. Source: http://www.nasscom.org/artdisplay.asp? June 24-26, 2007 Oxford University, UK 19 2007 Oxford Business & Economics Conference ISBN : 978-0-9742114-7-3 Table 11:International Differences in Salaries Paid to Software Professionals, 1995 (in thousand US$) ---------------------------------------------------------------------------------------Switzerland USA Canada UK Ireland Greece India ----------------------------------------------------------------------------------------Project leader 74 54 39 39 43 24 23 Business analyst 74 38 36 37 36 28 21 Systems analyst 74 48 32 34 36 15 14 Systems designer 67 55 36 34 31 15 11 Development 56 41 29 29 21 13 8 programmer Support 56 37 26 25 21 15 8 programmer Network analyst 67 49 32 31 26 15 14 / designer Quality assurance 71 50 28 33 29 15 14 specialist Database data 67 50 32 22 29 24 17 analyst Metrics / process 74 48 29 31 – 15 17 specialist Documentation/ 59 36 26 21 – 15 8 training staff Test engineer 59 47 25 24 – 13 8 ----------------------------------------------------------------------------------------Source: Arora and Athreye (2002) Table 12: Comparative Advantage in Software Production Across Selected Countries, 1995 ----------------------------------------------------------------------------------------All manufacturing Software Comparative advantage Output per Value added Revenue per per Index 1 Index 2 employee (1) employee (2) employee (3) (3) /(1) (3) /(2) ($’000) ($’000) ($’000) ----------------------------------------------------------------------------------------Israel 112.20 38.30 100.00 0.89 2.61 Ireland India France 242.20 117.10 142.24 0.59 1.22 20.80 4.10 8.93 0.43 2.18 205.13 77.14 161.32 0.79 2.09 76.16 83.46 0.36 1.10 126.02 0.61 1.28 Finland 231.92 USA 206.00 98.20 -----------------------------------------------------------------------------------------Source: Arora and Athreye (2002) June 24-26, 2007 Oxford University, UK 20 2007 Oxford Business & Economics Conference ISBN : 978-0-9742114-7-3 Table 13: Software Plus ITES Exports From Important Countries in Year 2002 ---------------------------------------------------------------million US$ % of Total ---------------------------------------------------------------India 9500 56.4 Canada 3780 22.5 Ireland 1920 11.4 Israel 900 5.3 Phillipines 640 3.8 S. Africa 96 0.6 Total 16836 100.0 --------------------------------------------------------------Source: http://www.nasscom.org/artdisplay.asp? Table 14: Percentage Share of Different Classes of Firms in Total Revenue: 2003-04 -------------------------------------------------------------------Firms % Share -------------------------------------------------------------------Firms with revenue > Rs. 10 billion 32 ( Top 5 Firms) Firms with revenue Rs. 1 to 10 billion 24 MNC backends 26 Focussed companies 4 Firms with revenue < Rs.1 billion 14 ------------------------------------------------------------------http://www.nasscom.org/artdisplay.asp? June 24-26, 2007 Oxford University, UK 21 2007 Oxford Business & Economics Conference ISBN : 978-0-9742114-7-3 Table 15 : Revenue in US $/ Indian Rs. Per Knowledge Professional -------------------------------------------------------------------------------------------------At current prices in US $ At 1993-94 prices in Indian Rs. Software ITES Software ITES --------------------------------------------------------------------------------------------------1995-96 7650 192500 1996-97 1997-98 1998-99 1999-00 20917 14286 580449 396424 2000-01 20495 12857 576919 361911 2001-02 20253 14151 575411 402048 2002-03 20685 15789 538686 411191 2003-04 20606 15918 543463 419838 2004-05 16667 399466 ---------------------------------------------------------------------------------------------------Table 16: Information Technology Services Sector: Median Pay in 2002 and 2003 Indian Rupees in thousand --------------------------------------------------------------------------------------------------Levels Description 2002 2003 Percentage Change --------------------------------------------------------------------------------------------------HA1 Software Engineer 216 267 23.6 HA2 Sr Software Engineer 299 424 41.8 HA3 396 583 47.2 HA4 Team Leader/Module Leader Project Leader 594 850 43.1 HA5 Project Manager 784 1,178 HA6 50.3 Program Manager/ 1,232 1,801 46.2 Sr Project Manager HA7 Head-Software Devt 1,686 2,670 58.4 /Large Business Unit --------------------------------------------------------------------------------------------------Source: NASSCOM Hewitt Total Rewards Study 2002, 2003 http://www.nasscom.org/artdisplay.asp?cat_id=731 Note: Pay is Cost to Company and includes all benefits. June 24-26, 2007 Oxford University, UK 22 2007 Oxford Business & Economics Conference ISBN : 978-0-9742114-7-3 Table 17 : Output of Advanced Software Products and Number of Fortune 500 Companies Serviced Amount in billion US dollars ----------------------------------------------------------------------------------------------------------Year Software R&D offsoring Total Percentage Fortune500 Percentage Product Embedded Growth companies Growth system serviced -----------------------------------------------------------------------------------------------------------2002-03 0.56 1.11 1.67 2003-04 0.71 1.60 2.31 38.3 300 2004-05 3.00 29.9 400 33.3 Average growth rate 34.1 ----------------------------------------------------------------------------------------------------------http://www.nasscom.org/artdisplay.asp? June 24-26, 2007 Oxford University, UK 23 2007 Oxford Business & Economics Conference ISBN : 978-0-9742114-7-3 Appendix Table: R&D Undertakings List by MNC Firms -------------------------------------------------------------------------------------------------Siemens: The Corporate Technology Department of Siemens has set up a research centre in Bangalore, which will focus on high-end R&D in software engineering technologies for multi-site global product line developments, client-server technologies for next-generation medical imaging solutions, and embedded software for security and automotive applications Snecma Aerospace India (SAI), the R&D centre of Snecma in India is involved in the development f components of aero-engines and aircraft equipment and embedded software to cater to its worldwide operations. Schneider in partnership with Tata Elxsi: The global R&D centre of Schneider Electric in Bangalore and the Indian product design company Tata Elxsi have announced the creation of a dedicated software competency centre that will be involved in the development and testing of embedded software applications offered by Schneider Electric. Texas Instruments: Develops embedded software for Broadband, Digital Signal Processor (DSP),Wireless terminal and OMAP applications, Device drivers and operating systems, Multimedia CODECS, Integrated software development environment. Sun Microsytems and Cadence Design have teamed up with Veda Institute of Information Technology, Hyderabad to start India 뭩 first nodal centre of competency for R&D in VLSI engineering, design automation and embedded system engineering. Intel: In October 2004,Intel opened its first test lab-Enterprise Platform Group (EPG)in Bangalore, India. Intel, thus has end-to-end product development capability -generating innovative, cost-effective debug and test solutions for all products coming out of India. Samsung: The company has about 850 engineers in India at its two R&D centres Bangalore and Noida (UP)?that work on cutting edge technologies like embedded software, home network, IPV6, etc. Motorola: Over 900 engineers work at Motorola 뭩 Global Software Group (GSG)at Bangalore and Hyderabad centres for creating cutting edge technological solutions for wireless products and infrastructure, providing embedded solutions and services for 3G Phones, UMTS and Cable Modem systems. Philips: The company 뭩 R&D centre in Bangalore -Philips Innovation Campus supports its global research on medical systems, semiconductors and mobile June 24-26, 2007 Oxford University, UK 24 2007 Oxford Business & Economics Conference ISBN : 978-0-9742114-7-3 phone operating systems. The centre currently employs around 1,500 engineers and the number is expected to reach 3,000 in the next two years. Delphi: Delphi Technical Centre India in Bangalore, meets the global needs for vehicle software engineering, math based applications and product development particularly in software development, engineering analysis and Computer Aided Design (CAD).The centre employs over 350 engineers working to develop embedded software technologies. The centre is also slated to become a centre of expertise for development of web based tools to automated engineering, modeling and business processes at Delphi electronics and safety division. Daimler: The company through its Research and Tech group in Bangalore runs alliances with 10 IT majors in the country. Besides the 100 seater centre in Bangalore also carries out dedicated research for DaimlerChrysler’s global operations. Bosch: The software division develops software solutions for Bosch units in many countries including USA, Europe and Asia-Pacific. It is developing embedded software for control units, tools and diagnostics, besides mechanical design services and shared service centre accounting for Bosch operations worldwide. --------------------------------------------------------------------------------------------------Source: http://www.nasscom.org/artdisplay.asp?cat_id=786 June 24-26, 2007 Oxford University, UK 25 2007 Oxford Business & Economics Conference ISBN : 978-0-9742114-7-3 Figure 1: Domestic Market, Exports and Total Production of Software and IT Enabled Services in India Billion US Dollars 35.000 30.000 25.000 20.000 15.000 10.000 5.000 0.000 95-96 96-97 97-98 98-99 99-00 00-01 01-02 02-03 03-04 04-05 05-06 Domestic Market June 24-26, 2007 Oxford University, UK Exports 26 Total Production 2007 Oxford Business & Economics Conference ISBN : 978-0-9742114-7-3 Figure 2: Production of Software and IT Enabled Services as Percentage of GDP in India 4.00 3.50 3.00 2.50 2.00 1.50 1.00 0.50 0.00 19992000 June 24-26, 2007 Oxford University, UK 2000-01 2001-02 27 2002-03 2003-04 2004-05

