Prevalence of undernourishment
advertisement

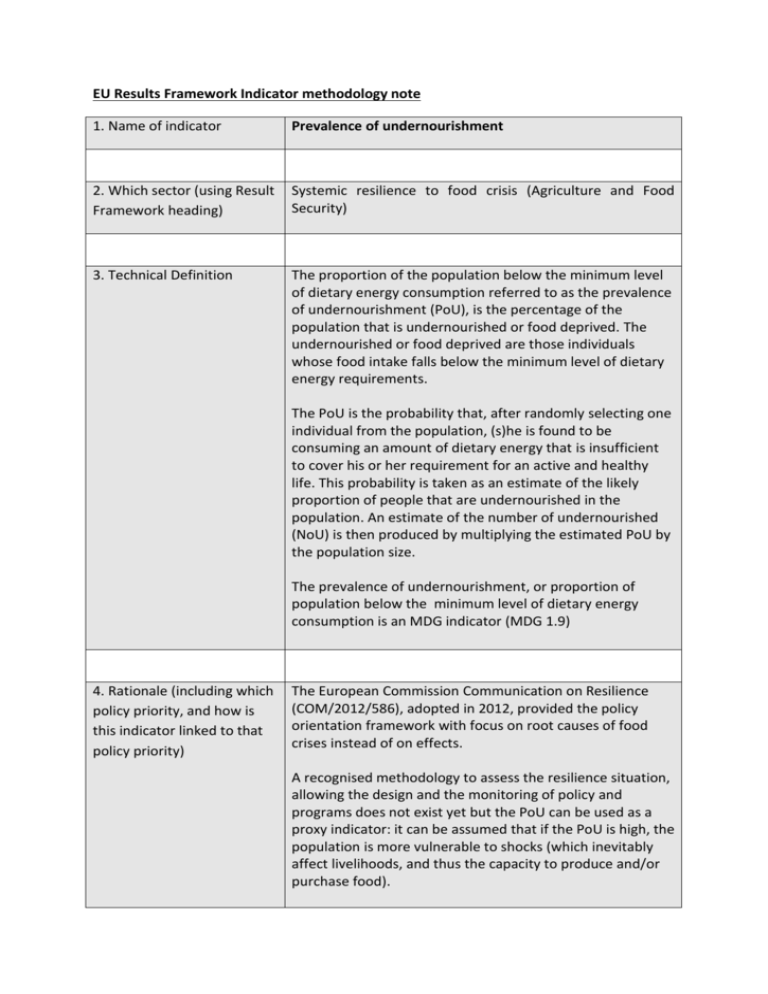
EU Results Framework Indicator methodology note 1. Name of indicator Prevalence of undernourishment 2. Which sector (using Result Framework heading) Systemic resilience to food crisis (Agriculture and Food Security) 3. Technical Definition The proportion of the population below the minimum level of dietary energy consumption referred to as the prevalence of undernourishment (PoU), is the percentage of the population that is undernourished or food deprived. The undernourished or food deprived are those individuals whose food intake falls below the minimum level of dietary energy requirements. The PoU is the probability that, after randomly selecting one individual from the population, (s)he is found to be consuming an amount of dietary energy that is insufficient to cover his or her requirement for an active and healthy life. This probability is taken as an estimate of the likely proportion of people that are undernourished in the population. An estimate of the number of undernourished (NoU) is then produced by multiplying the estimated PoU by the population size. The prevalence of undernourishment, or proportion of population below the minimum level of dietary energy consumption is an MDG indicator (MDG 1.9) 4. Rationale (including which policy priority, and how is this indicator linked to that policy priority) The European Commission Communication on Resilience (COM/2012/586), adopted in 2012, provided the policy orientation framework with focus on root causes of food crises instead of on effects. A recognised methodology to assess the resilience situation, allowing the design and the monitoring of policy and programs does not exist yet but the PoU can be used as a proxy indicator: it can be assumed that if the PoU is high, the population is more vulnerable to shocks (which inevitably affect livelihoods, and thus the capacity to produce and/or purchase food). The PoU indicator also allows to identify the most vulnerable areas where EU interventions should be concentrated (in line with the Agenda for Change (2011)). 5. Level of disaggregation N/A 6. Data Sources (including any issues on (i) different definitions by source, and (ii) level of availability of the data) 1. Prevalence of undernourishment (% of population) is reported by the UN Statistics Division based on data collected by FAO. Data are available at http://mdgs.un.org/unsd/mdg/Data.aspx >Goal 1 >Target 1C The information about the average food available for human consumption comes from national “food balance sheets” compiled by FAO every year which estimate how much of each food commodity a country produces, imports and withdraws from stocks for other non-food purposes. FAO then divides the energy equivalent of all the food available for human consumption by the total population to come up with average daily energy consumption. Data from household surveys are used to derive a coefficient of variation to account for the degree of inequality in access to food. Similarly, since a large adult needs almost twice as much dietary energy as a three-year-old child, the minimum energy requirement per person for each country takes into account its mix of age, gender and body sizes. [Note: Prevalence of stunting is defined in another methodological note.1] 2. UN Population data http://esa.un.org/unpd/wpp/ExcelData/population.htm (Use the "estimates" sheet. Where it is necessary to use population forecasts because estimates are not yet available, use the "median fertility" variant). This will give the population data that will be used for weighting. 7. Data calculation (including any assumptions made) 1 To be calculated by: a) taking the latest available rate of undernourishment for each country where the EU has external action programmes N.B. Prevalence of stunting is a more complete indicator, compared to PoU. Nevertheless PoU is calculated every year, prevalence of stunting is calculated each 4-5 years, or more (the frequency is not constant). from the UN Statistics Division MDG country database b) multiplying this number by the population data for the country in that same year. c) adding together the above numbers for all the countries where the EU has external action programmes. This will give the first element for a weighted average of prevalence of undernourishment. d) adding together the populations of all the countries where the EU has external action programmes. This will give the second element for a weighted weighted average of prevalence of undernourishment. e) dividing the first element (c) by the second element (d). This will give the weighted average of prevalence of undernourishment. 8. Worked examples* Botswana 2013 Proportion of population undernourished = 26.6% Population = 2,021,144 Guyana 2013 Proportion of population undernourished = 10.0% Population = 799,613 Weighted average of the Proportion of population undernourished for Botswana and Guyana = Examples correct at the time of writing (Dec 2014) 9. Is it used by another organization or in the framework of international initiatives, conventions, etc? If so, which? 10.Other issues (0.266*2,021,144 + 0.100*799,613) / (2,021,144 + 799,613) = 21.9% The PoU and NoU (number of undernourished: produced by multiplying the estimated PoU by the population size) have been adopted as indicators used to monitor progress towards the targets set by the Millennium Development Goals (in particular, the hunger target of MDG 1) and at the World Food Summit, respectively. The PoU index should be associated with the prevalence of stunting index. This example will clarify the reason: In Mali the prevalence of undernourishment was estimated at 7 percent in 2011–13, while 38 percent of children under five years of age were stunted. If we just consider the PoU we could think about a food availability issue. Instances of relatively low undernourishment but high malnutrition may call for policy measures and related programmes aimed at improving access to safe and nutritious food, promoting dietary diversity, improving food safety and supporting hygiene. 1. The indicator is based on a narrow definition of “hunger”, covering only chronic conditions of inadequate dietary energy intake. Other aspects of food inadequacy, for example micronutrient deficiencies, are not captured. This explains why we associate to the PoU the prevalence of stunting, which integrates macro and micro nutrient components. 2. The PoU indicator systematically underestimates undernourishment, as it assumes a minimum level of physical activity, typical of a sedentary lifestyle. Hence the indicator neglects the fact that many poor people are engaged in demanding physical activities. 3. The methodology is complex and based on allegedly weak macro data, whereas household surveys alone allow for a direct and more accurate measurement of undernourishment. The PoU is computed yearly. The association with the prevalence of stunting (depending on Demographic and Health Surveys – whose frequency is not regular) would help to minimize the lack of accuracy.


