Thermocouple Temperature Measurement Lab
advertisement
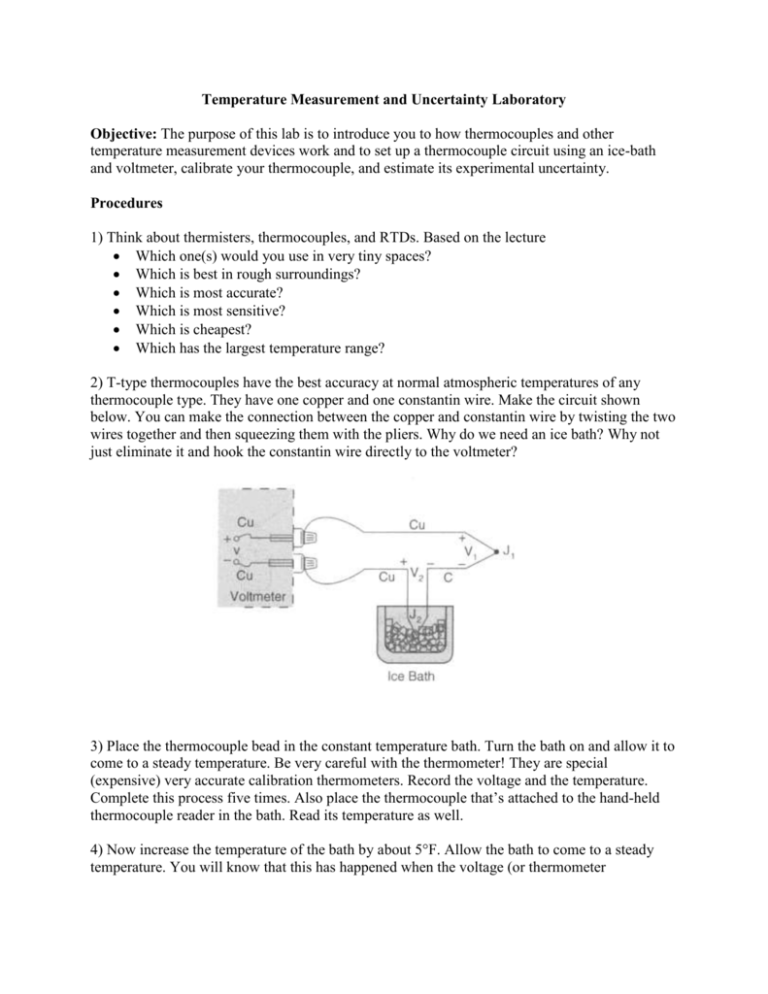
Temperature Measurement and Uncertainty Laboratory Objective: The purpose of this lab is to introduce you to how thermocouples and other temperature measurement devices work and to set up a thermocouple circuit using an ice-bath and voltmeter, calibrate your thermocouple, and estimate its experimental uncertainty. Procedures 1) Think about thermisters, thermocouples, and RTDs. Based on the lecture Which one(s) would you use in very tiny spaces? Which is best in rough surroundings? Which is most accurate? Which is most sensitive? Which is cheapest? Which has the largest temperature range? 2) T-type thermocouples have the best accuracy at normal atmospheric temperatures of any thermocouple type. They have one copper and one constantin wire. Make the circuit shown below. You can make the connection between the copper and constantin wire by twisting the two wires together and then squeezing them with the pliers. Why do we need an ice bath? Why not just eliminate it and hook the constantin wire directly to the voltmeter? 3) Place the thermocouple bead in the constant temperature bath. Turn the bath on and allow it to come to a steady temperature. Be very careful with the thermometer! They are special (expensive) very accurate calibration thermometers. Record the voltage and the temperature. Complete this process five times. Also place the thermocouple that’s attached to the hand-held thermocouple reader in the bath. Read its temperature as well. 4) Now increase the temperature of the bath by about 5°F. Allow the bath to come to a steady temperature. You will know that this has happened when the voltage (or thermometer temperature) have reached a steady value. This should take at least five minutes. Take another five readings of thermometer and thermocouple reader temperature and voltage. 5) Repeat this process until you have readings at five different temperatures. 6) At one of the temperatures, you will need to take 35 voltage readings. This will allow you to later estimate the random error. Data Analysis 1) Plot your average temperature versus average voltage for the five temperature readings on a graph. (At this point ignore the hand-held thermocouple reader data.) Make a curve-fit to the data. Excel has a nice curve-fitting option, but you may use other programs as well. Come up with an equation for temperature as a function of voltage. If you use Excel, you can do this by making an X-Y scatter plot and then going to “Add Trendline”. Under “Add Trendline”, go to the “Options” and click on the options to “Display equation on chart” and “Display R2 value on chart”. (An R2 value of 1 means perfect agreement between your trendline and your data.). Is the relationship between voltage and temperature linear? If not, what type of relationship is there? 2) For each of your five data points, plug your average voltage into your new equation. Find the difference between the measured temperature and the temperature predicted by your trendline for your five cases. Make a table such as the one below. Average voltage reading (mV) Average temp. measurement (°F) Temp. predicted from trendline (°F) Difference between measured and predicted temp (°F) Handheld thermocouple reader temp. (°F) Difference between reader and thermometer temp (°F) For this case, you can estimate the bias error as the largest value of the difference between measured and predicted temperatures. 3) Using the 35 voltage readings that you measured at one temperature, estimate the random error. Use the equations presented in the lecture. 4) Now calculate the uncertainty of your temperature reading. Thought Questions 1) Which is more accurate – the handheld reader or your new temperature-voltage trendline (assuming that the actual temperature is the average measured temperature)? 2) List several ways that you could improve the quality of your calibration. 3) If you used this thermocouple and your calibration to measure a temperature difference of 0.9 °F, what would be the uncertainty of that value? See the lecture notes if you need to remember how to deal with a temperature difference. What does this tell you about the accuracy of small temperature differences with a thermocouple? What piece of equipment would you suggest to use to measure this small temperature difference (see the lecture notes)?
