sample report
advertisement
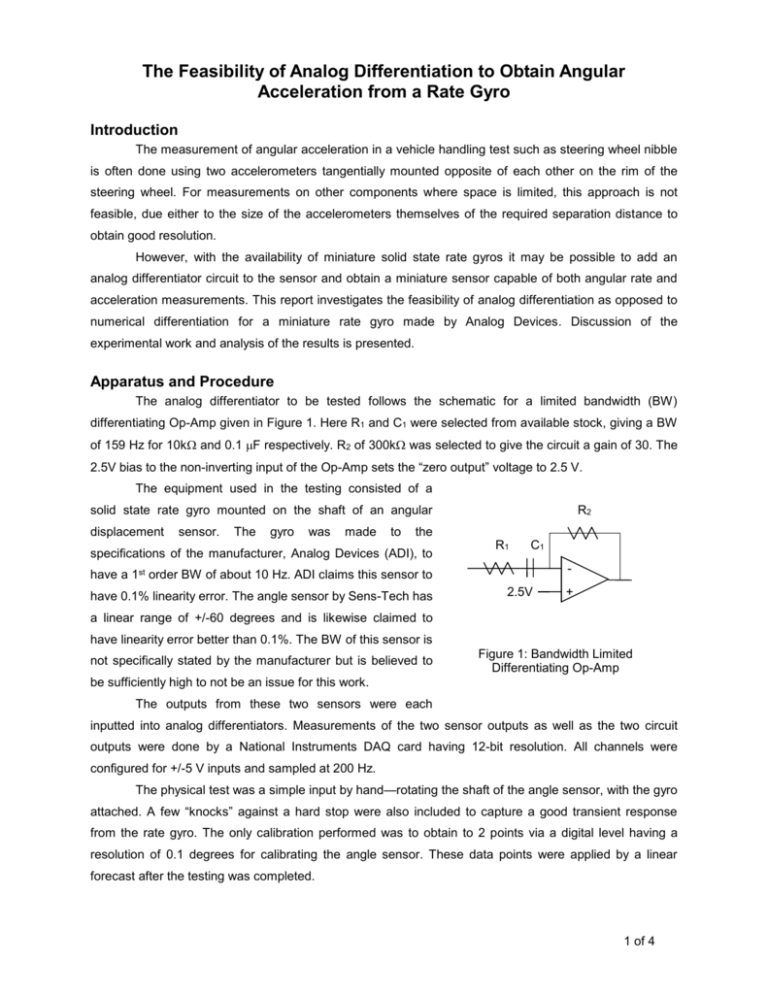
The Feasibility of Analog Differentiation to Obtain Angular Acceleration from a Rate Gyro Introduction The measurement of angular acceleration in a vehicle handling test such as steering wheel nibble is often done using two accelerometers tangentially mounted opposite of each other on the rim of the steering wheel. For measurements on other components where space is limited, this approach is not feasible, due either to the size of the accelerometers themselves of the required separation distance to obtain good resolution. However, with the availability of miniature solid state rate gyros it may be possible to add an analog differentiator circuit to the sensor and obtain a miniature sensor capable of both angular rate and acceleration measurements. This report investigates the feasibility of analog differentiation as opposed to numerical differentiation for a miniature rate gyro made by Analog Devices. Discussion of the experimental work and analysis of the results is presented. Apparatus and Procedure The analog differentiator to be tested follows the schematic for a limited bandwidth (BW) differentiating Op-Amp given in Figure 1. Here R1 and C1 were selected from available stock, giving a BW of 159 Hz for 10k and 0.1 F respectively. R2 of 300k was selected to give the circuit a gain of 30. The 2.5V bias to the non-inverting input of the Op-Amp sets the “zero output” voltage to 2.5 V. The equipment used in the testing consisted of a R2 solid state rate gyro mounted on the shaft of an angular displacement sensor. The gyro was made to the specifications of the manufacturer, Analog Devices (ADI), to R1 C1 - have a 1st order BW of about 10 Hz. ADI claims this sensor to have 0.1% linearity error. The angle sensor by Sens-Tech has 2.5V + a linear range of +/-60 degrees and is likewise claimed to have linearity error better than 0.1%. The BW of this sensor is not specifically stated by the manufacturer but is believed to Figure 1: Bandwidth Limited Differentiating Op-Amp be sufficiently high to not be an issue for this work. The outputs from these two sensors were each inputted into analog differentiators. Measurements of the two sensor outputs as well as the two circuit outputs were done by a National Instruments DAQ card having 12-bit resolution. All channels were configured for +/-5 V inputs and sampled at 200 Hz. The physical test was a simple input by hand—rotating the shaft of the angle sensor, with the gyro attached. A few “knocks” against a hard stop were also included to capture a good transient response from the rate gyro. The only calibration performed was to obtain to 2 points via a digital level having a resolution of 0.1 degrees for calibrating the angle sensor. These data points were applied by a linear forecast after the testing was completed. 1 of 4 Results and Discussion Analysis was done to establish the BW and sensitivity of the gyro, compare the gyro signal to the analog and numerical derivatives of the angle sensor, and compare the analog and numerical derivatives of the gyro output as a measure of angular acceleration. This is described and discussed in this section. Bandwidth and Sensitivity Analysis The BW of the gyro was not known exactly, so the BW and sensitivity of the gyro were investigated simultaneously on the premise that at the correct BW the analog and numerical derivatives of the angle sensor output will give the lowest possible linear error when used to calibrate the gyro output over the run of nearly 18 seconds of motion. Thus, for a given BW frequency, the calibrated angle signal and the analog derivative of the angle sensor were low-pass filtered through a 1st order system at that frequency. The filtered, calibrated angle signal was numerically differentiated by central differences to obtain an estimated angular velocity and then used with the circuit output to forecast a calibrated analog derivative. Both calibrated derivatives were then used to calibrate the rate gyro output, again by linear forecast, and calculate a residual linear error for each derivative method. The root-mean-square (RMS) values of the linear errors and the calculated sensitivities over a range of investigated BW frequencies are plotted in Figure 2. Analysis with the numerical derivative predicts a BW of 9.8 Hz and sensitivity of 190.6 Deg/s/V, whereas the circuit output predicts 10.9 Hz and 191.8 Deg/s/V. (ADI states the sensitivity to be 200±15 Deg/s/V.) Though the sensitivities differ by only 0.6%, the BW by the analog derivative should be discounted: it is believed that the dynamics of the circuit, having a 1st order BW of nearly 160 Hz, reduced the real phase difference between the gyro output and circuit so that it would appear to be due to a slightly higher BW of the gyro itself. The BW of the gyro was taken to be 9.8 Hz. Angular Velocity by Gyro, Analog Derivative, and Numerical Derivative From Figure 2, the minimum RMS linear error observed in the calibration work was about 0.59 deg/s and 0.64 deg/s for the circuit output and the numerical derivative. Inspection of the time histories of the linear error by these two methods shows about 90% of all errors to be less than 1 deg/s, or about 0.17% of the full scale range of the gyro, ±300 deg/s. Closer inspection of the time histories of the calibrated signals shows the gyro to be operating at the limit of the DAQ resolution with “noise”, or uncertainty in any measurement, being about 1/2 LSB, or about 0.25 deg/s. Compared to the gyro, the circuit and numerical derivative show higher noise levels as noted, however, these signals have been low-pass filtered. Without the filtering, both show more noise in addition to being out of phase with the gyro output. The numerical derivative shows simple numerical error caused by differentiating a sampled time history: higher sample rates make this noise worse. The analog derivative shows noise and response to inputs, real or otherwise, from the angle sensor that the gyro, having a low BW, would not respond to. Still, the “noise” levels are not disagreeable: at rest, 95% of the circuit output values are 2 deg/s or less, as compared to filtered circuit output values of about 1 deg/s. 2 of 4 This can be improved by lowering the BW of the differentiator, by increasing the order of BW limit, or simply filtering the measured signals as done for the calibration work above, possibly specifying a more aggressive filter. RMS Linear Error, Deg/s 1.0 Circuit Numerical 0.9 0.8 0.7 0.6 0.5 9 9.5 10 10.5 11 11.5 Bandwidth, Hz Sensitivity, Deg/s/V 191.0 190.5 190.0 189.5 Circuit Numerical 189.0 9 9.5 10 10.5 11 11.5 Bandwidth, Hz Figure 2: RMS Linear Error and Sensitivity versus Bandwidth for Calibrations Based on Derivatives Obtained by Analog Differentiator Circuit and Numerical Differentiation. Angular Acceleration Having established the calibration of the gyro and the comparable quality of the analog derivative, the angular acceleration can be discussed. The calibrated rate gyro output was numerically differentiated to obtain an angular acceleration signal which was then used by linear forecast to calibrate the output of a second analog differentiator acting on the gyro output. These two signals are plotted in Figure 3, with the numerical estimate shifted by 500 deg/s2 for ease of comparison. The time history shows the system at rest until 7.6 s, at which time the shaft is turned one way and back again, allowing the shaft to hit a “hard stop” at about 8.3 s. Motion has stopped at this point, but the yaw rate circuit transient response continues until about 8.4 s. The two signals are nominally identical, the only difference being the noise characteristics. The numerical derivative shows typical noise induced by the differentiation—a quantization effect showing a “resolution” of 50 deg/s2. This is especially noticeable during the periods of no motion. The analog derivative shows slightly more noise of a random nature, but it is not obtrusive. In fact, the resolution is 3 of 4 better, being about 15 deg/s2. Had the gain been higher than 30, this would further improve, lowering the noise floor of any spectral analysis and revealing details that the numerical derivative would not show. This then, is the value of the analog derivative. 2000 Circuit Numerical 1500 Acceleration, deg/s 2 1000 500 0 -500 -1000 7 7.2 7.4 7.6 7.8 8 Time, s 8.2 8.4 8.6 8.8 9 Figure 3: Angular Acceleration Estimated from a Rate Gyro by Analog Differentiator Circuit and Numerical Differentiation Furthermore, the analog differentiator permits the measurement of angular acceleration from a low cost sensor, in addition to leaving the original sensor output available—two signals for the price of one. As the ADI gyro is 7x7 mm square and the Op-Amp is available in even smaller surface mount packages, the resulting sensor would be quite small. The differentiator in this case was of only 1st order BW, but the circuit can be modified to have higher order dynamics and thus build in some filtering. Conclusion The work presented establishes the feasibility of analog differentiation to obtain angular acceleration from a miniature, low-cost rate gyro. Comparison of analog and numerical derivatives showed the differentiator to have good noise levels and dynamic performance. Furthermore, the approach may be further improved by the design of differentiating circuits with higher-order filtering and increased sensitivity. 4 of 4
