reference data ()
advertisement
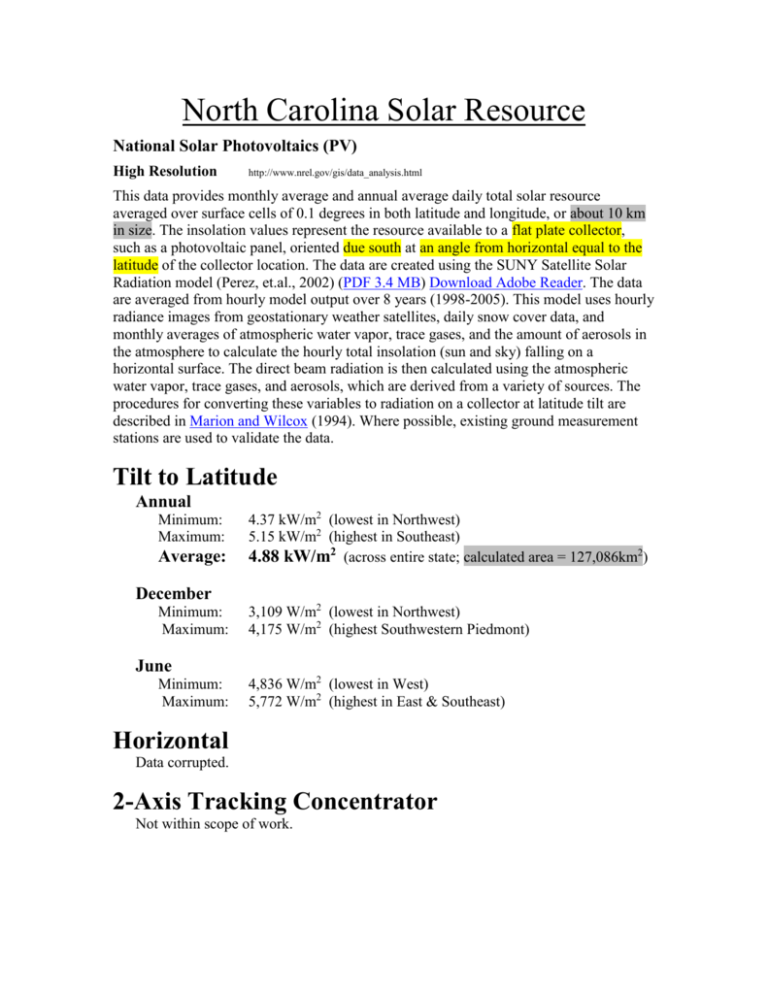
North Carolina Solar Resource National Solar Photovoltaics (PV) High Resolution http://www.nrel.gov/gis/data_analysis.html This data provides monthly average and annual average daily total solar resource averaged over surface cells of 0.1 degrees in both latitude and longitude, or about 10 km in size. The insolation values represent the resource available to a flat plate collector, such as a photovoltaic panel, oriented due south at an angle from horizontal equal to the latitude of the collector location. The data are created using the SUNY Satellite Solar Radiation model (Perez, et.al., 2002) (PDF 3.4 MB) Download Adobe Reader. The data are averaged from hourly model output over 8 years (1998-2005). This model uses hourly radiance images from geostationary weather satellites, daily snow cover data, and monthly averages of atmospheric water vapor, trace gases, and the amount of aerosols in the atmosphere to calculate the hourly total insolation (sun and sky) falling on a horizontal surface. The direct beam radiation is then calculated using the atmospheric water vapor, trace gases, and aerosols, which are derived from a variety of sources. The procedures for converting these variables to radiation on a collector at latitude tilt are described in Marion and Wilcox (1994). Where possible, existing ground measurement stations are used to validate the data. Tilt to Latitude Annual Minimum: Maximum: Average: 4.37 kW/m2 (lowest in Northwest) 5.15 kW/m2 (highest in Southeast) 4.88 kW/m2 (across entire state; calculated area = 127,086km2) December Minimum: Maximum: 3,109 W/m2 (lowest in Northwest) 4,175 W/m2 (highest Southwestern Piedmont) June Minimum: Maximum: 4,836 W/m2 (lowest in West) 5,772 W/m2 (highest in East & Southeast) Horizontal Data corrupted. 2-Axis Tracking Concentrator Not within scope of work.
