Centrality Exercise: Network Analysis with UCInet & Netdraw
advertisement
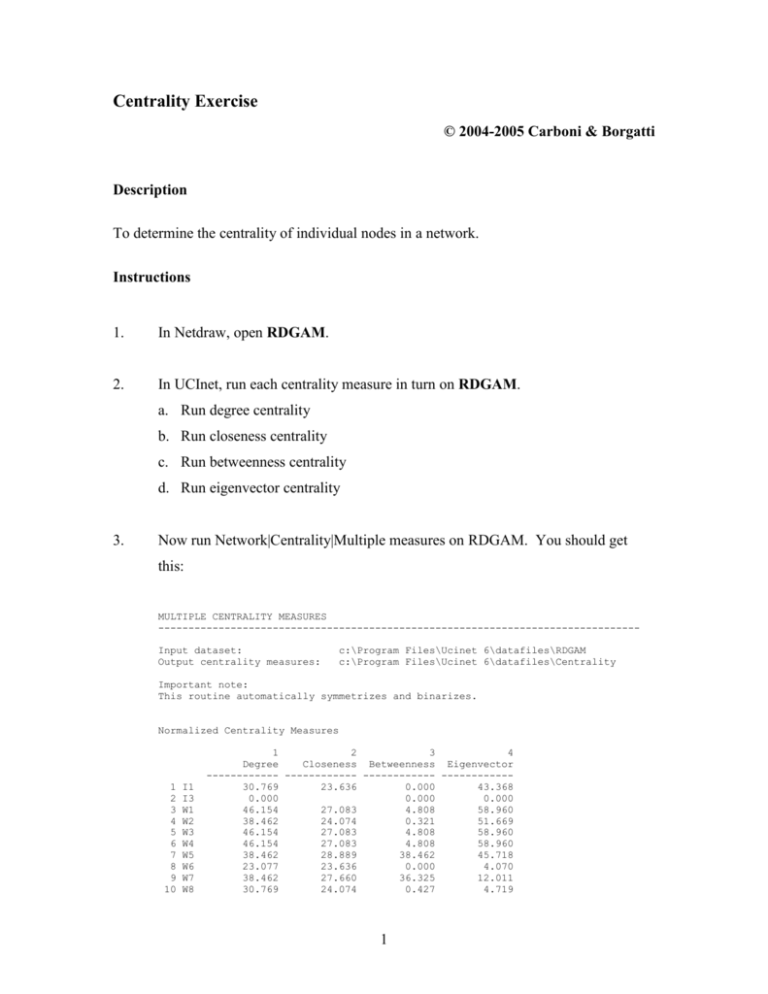
Centrality Exercise © 2004-2005 Carboni & Borgatti Description To determine the centrality of individual nodes in a network. Instructions 1. In Netdraw, open RDGAM. 2. In UCInet, run each centrality measure in turn on RDGAM. a. Run degree centrality b. Run closeness centrality c. Run betweenness centrality d. Run eigenvector centrality 3. Now run Network|Centrality|Multiple measures on RDGAM. You should get this: MULTIPLE CENTRALITY MEASURES -------------------------------------------------------------------------------Input dataset: Output centrality measures: c:\Program Files\Ucinet 6\datafiles\RDGAM c:\Program Files\Ucinet 6\datafiles\Centrality Important note: This routine automatically symmetrizes and binarizes. Normalized Centrality Measures 1 2 3 4 5 6 7 8 9 10 I1 I3 W1 W2 W3 W4 W5 W6 W7 W8 1 2 3 4 Degree Closeness Betweenness Eigenvector ------------ ------------ ------------ -----------30.769 23.636 0.000 43.368 0.000 0.000 0.000 46.154 27.083 4.808 58.960 38.462 24.074 0.321 51.669 46.154 27.083 4.808 58.960 46.154 27.083 4.808 58.960 38.462 28.889 38.462 45.718 23.077 23.636 0.000 4.070 38.462 27.660 36.325 12.011 30.769 24.074 0.427 4.719 1 11 12 13 14 W9 S1 S2 S4 30.769 38.462 0.000 23.077 24.074 26.531 0.427 1.923 0.000 0.000 23.636 4.719 52.043 0.000 4.070 Important note: This network is disconnected. Technically, closeness should not be computed. You should consider rerunning this program on each component separately. DESCRIPTIVE STATISTICS FOR EACH MEASURE 1 Mean 2 Std Dev 3 Sum 4 Variance 5 SSQ 6 MCSSQ 7 Euc Norm 8 Minimum 9 Maximum 1 2 3 4 Degree Closeness Betweenness Eigenvector ------------ ------------ ------------ -----------30.769 25.622 6.593 28.519 14.537 1.850 12.716 24.804 430.769 307.460 92.308 399.269 211.327 3.423 161.690 615.226 16213.019 7918.730 2872.288 19999.998 2958.580 41.073 2263.666 8613.162 127.330 88.987 53.594 141.421 0.000 23.636 0.000 0.000 46.154 28.889 38.462 58.960 Output actor-by-centrality measure matrix saved as dataset Centrality ---------------------------------------Running time: 00:00:01 Output generated: 05 Nov 04 13:34:33 a. Compare the profile of W1 with W5 across all measures. Note that W1 is stronger in eigenvector while W5 is stronger on betweenness b. Compare W5 with W7. They have same degree. Why is W7 so much weaker on eigenvector centrality? 4. Remove isolates then recalculate centrality measures a. In UCINET, run Data|Remove Isolates on RDGAM b. Compare the results for closeness centrality (esp descriptive statistics) with those from the previous run. The present numbers make more sense. 5. In Netdraw, open Borg4cent 2 6. In UCInet, run Network|Centrality|Multiple measures. Call the output dataset CentralityBorg a. Note that no node is highest on all measures b. Which nodes are best positioned to quickly and certainly receive information flowing through the network? c. Which nodes can directly infect the most others with a disease? d. Which nodes have the most control over the flow of goods across the network? e. Which nodes are connected to many others who are themselves wellconnected? f. Analyze similarities among the centrality measures. Go to tools|similarities and input CentralityBorg. Let the measure of similarity be Pearson’s correlation coefficient. Specify columns. 3
