West Virginia Digital Topographic Map:
advertisement
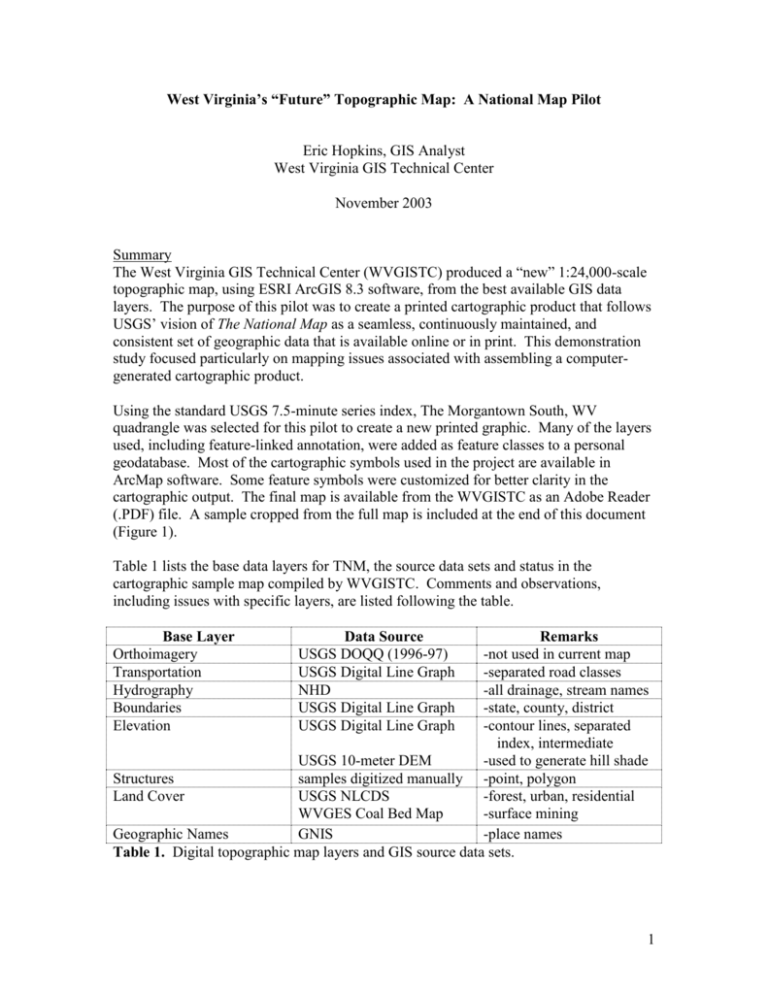
West Virginia’s “Future” Topographic Map: A National Map Pilot Eric Hopkins, GIS Analyst West Virginia GIS Technical Center November 2003 Summary The West Virginia GIS Technical Center (WVGISTC) produced a “new” 1:24,000-scale topographic map, using ESRI ArcGIS 8.3 software, from the best available GIS data layers. The purpose of this pilot was to create a printed cartographic product that follows USGS’ vision of The National Map as a seamless, continuously maintained, and consistent set of geographic data that is available online or in print. This demonstration study focused particularly on mapping issues associated with assembling a computergenerated cartographic product. Using the standard USGS 7.5-minute series index, The Morgantown South, WV quadrangle was selected for this pilot to create a new printed graphic. Many of the layers used, including feature-linked annotation, were added as feature classes to a personal geodatabase. Most of the cartographic symbols used in the project are available in ArcMap software. Some feature symbols were customized for better clarity in the cartographic output. The final map is available from the WVGISTC as an Adobe Reader (.PDF) file. A sample cropped from the full map is included at the end of this document (Figure 1). Table 1 lists the base data layers for TNM, the source data sets and status in the cartographic sample map compiled by WVGISTC. Comments and observations, including issues with specific layers, are listed following the table. Base Layer Orthoimagery Transportation Hydrography Boundaries Elevation Data Source USGS DOQQ (1996-97) USGS Digital Line Graph NHD USGS Digital Line Graph USGS Digital Line Graph Remarks -not used in current map -separated road classes -all drainage, stream names -state, county, district -contour lines, separated index, intermediate USGS 10-meter DEM -used to generate hill shade Structures samples digitized manually -point, polygon Land Cover USGS NLCDS -forest, urban, residential WVGES Coal Bed Map -surface mining Geographic Names GNIS -place names Table 1. Digital topographic map layers and GIS source data sets. 1 Layer-specific comments and issues Orthoimagery o Photo layers were not used in the initial demonstration product. It is anticipated that imagery will be available as an option in products eventually served out to the public. Transportation Roads o 1:24,000 scale Digital Line Graph (DLG), converted to an Arc/Info coverage, exported to a geodatabase arc feature class. This process can be extended to provide more detail in road classification o Road class and under passing attributes were assigned using a VisualBasic script. Symbology is attribute-based with some manual assignments required, e.g. expressway interchanges. Railroads o 1:24,000 scale DLG, converted and exported as with roads (see preceding Roads information). Miscellaneous o 1:24,000 scale DLG, pipelines, transmission lines, compressor stations, sub stations, also converted and exported as with roads (see preceding information). Hydrography o National Hydrologic Data set (NHD), 1:24,000 scale, polygon and arc features for the Upper Monongahela (NHD05020003) and Tygart (NHD05020001) watersheds. Polygons were dissolved in ArcMap to eliminate stream centerlines. Stream labels were obtained from the route.rch feature composite class. Boundaries o Tax District Boundaries: 1:24,000 scale DLG arcs, statewide, appended into single feature class by WVGISTC, October 2003. Spaces were added to name labels to improve cartographic display. o Incorporated Boundaries: Source was Census 2000 data. Elevation o Contours and spot elevations: USGS 1:24,000 DLG arc and point feature classes. A separate ‘Index’ class was created in the ArcMap label properties in order to display labels for index contours only, based on a contour type (index, 2 intermediate) domain established in the geodatabase. Contours derived from elevation grids have not yet been evaluated. o DEM / Hillshade: Hill shade background grid images were created from USGS 10-meter DEMs. Structures o Sample structures were manually digitized as polygons (large, commercial buildings) and points (houses) from USGS DOQQ imagery. o Point structure symbols are not rotated to actual structure orientations due to practical constraints. Land Cover o Forest (4 classes, green tint), urban / commercial / transportation (1 class, purple tint) and residential (2 classes, yellow tint) cover types were derived from the USGS National Land Cover Dataset (NLCD). o Urbanized areas were also derived from 2000 Census data and are displayed over the NLCD tints in a transparent, contrasting color. Geographic Names o The GNIS database was used for several classes of place and feature names. o Separate classes were created in the label properties dialog. These label classes were used to assign different text styles following the example of USGS topo quads. Other issues o Direct printing from ArcMap to a high-resolution plotter continues to provide challenges. Exporting to .PDF or other format and printing from other applications, e.g. Adobe Acrobat, more consistently achieve success. o Feature labels / annotations are sometimes lost in processing from ArcMap to PDF file. o Margins: It was difficult with ESRI ArcGIS software to replicate the position and content of coordinate reference tics and text on present-day topographic maps. 3 Figure 1. Sample graphic cropped from the Morgantown South, WV pilot map. 4
