Brain Imaging
advertisement
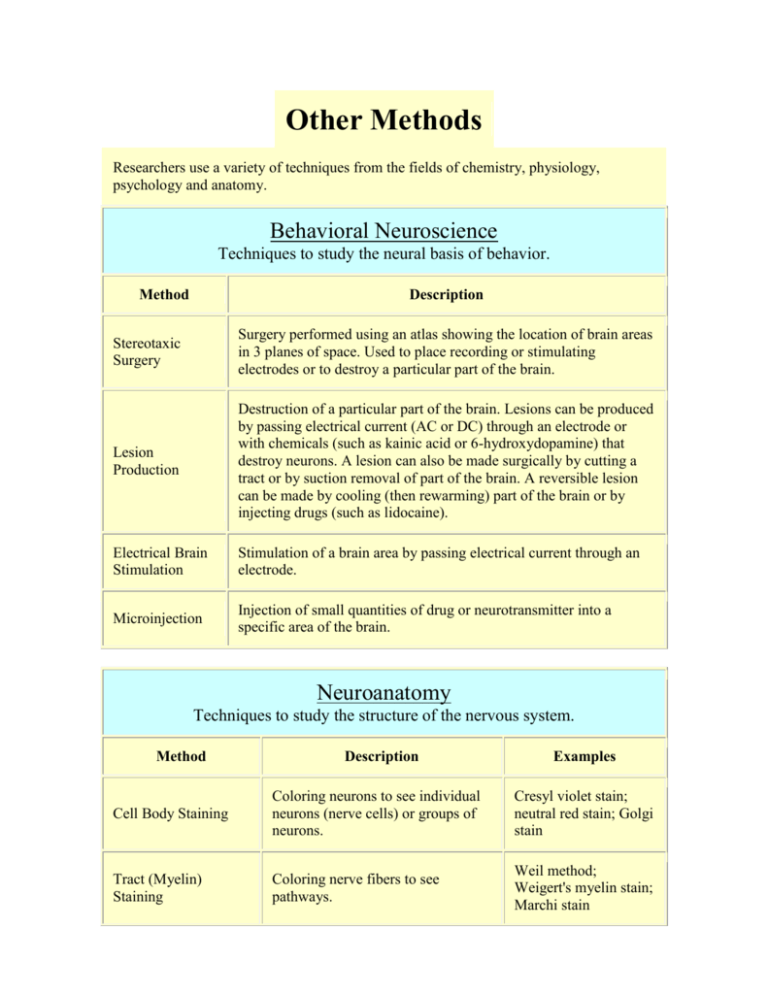
Other Methods Researchers use a variety of techniques from the fields of chemistry, physiology, psychology and anatomy. Behavioral Neuroscience Techniques to study the neural basis of behavior. Method Description Stereotaxic Surgery Surgery performed using an atlas showing the location of brain areas in 3 planes of space. Used to place recording or stimulating electrodes or to destroy a particular part of the brain. Lesion Production Destruction of a particular part of the brain. Lesions can be produced by passing electrical current (AC or DC) through an electrode or with chemicals (such as kainic acid or 6-hydroxydopamine) that destroy neurons. A lesion can also be made surgically by cutting a tract or by suction removal of part of the brain. A reversible lesion can be made by cooling (then rewarming) part of the brain or by injecting drugs (such as lidocaine). Electrical Brain Stimulation Stimulation of a brain area by passing electrical current through an electrode. Microinjection Injection of small quantities of drug or neurotransmitter into a specific area of the brain. Neuroanatomy Techniques to study the structure of the nervous system. Method Description Examples Cell Body Staining Coloring neurons to see individual neurons (nerve cells) or groups of neurons. Cresyl violet stain; neutral red stain; Golgi stain Tract (Myelin) Staining Coloring nerve fibers to see pathways. Weil method; Weigert's myelin stain; Marchi stain Tract Tracing Tracing the projections from one part of the nervous system to another part. Tracing can be retrograde (backwards) or anterograde (forwards). Electron Microscopy Electrons passed through tissue to produce more detailed images Immunocytochemistry Localizing particular chemicals (neurotransmitters, proteins) within particular neurons. In situ hybridization Localizing the synthesis of proteins or peptides in neurons. c-Fos c-Fos is a protein product of an immediate-early gene and has been used as a marker for brain areas activated by different stimuli. To see the c-Fos, immunocytochemical techniques must be used. Deoxyglucose Uptake Neurons that are active use glucose. By injecting deoxyglucose, the cells that use glucose also take up the deoxyglucose. However, the deoxyglucose is not degraded by enzymes in the neurons so it stays inside the neuron. By radioactively labeling the deoxyglucose, neuroscientist can find out what areas of the brain are active during specific behaviors or events. Horseradish peroxidase (HRP) method; fluorescent microspheres; Phaseolus vulgarisleucoagglutinin (PHAL) method; FluoroGold; Cholera B-toxin; DiI; tritiated amino acids Neurophysiology Techniques to understand the function of the nervous system. Method Description Patch Clamp Technique Recording current flow from single ion channels of a neuron. Intracellular Recording Electrical recording from INSIDE of a single neuron. Extracellular Recording Electrical recording from outside of a single (or a few) neuron. Mass Unit Recording Electrical recording from outside of a group of neurons. Evoked Potentials Electrical activity of the brain synchronized to an event. Electroencephalography (EEG) Electrical activity of the brain recorded with scalp or brain electrodes. The EEG can also be used to map the brain. Neuropharmacology Techniques to understand the chemistry of the nervous system. Method Microiontophoresis Description Injection of small quantities of chemicals (drugs, neurotransmitter) into neural tissue by passing electrical current. Brain Imaging Recent technology has enabled neuroscientists to "see" inside the living brain. These brain imaging methods help neuroscientists: Understand the relationships between specific areas of the brain and what function they serve. Locate the areas of the brain that are affected by neurological disorders. Develop new strategies to treat brain disorders. Procedure Method Computed Tomography Scan (CT Scan) CT scans use a series of X-ray beams passed through the head. The images are then developed on sensitive film. This method creates cross-sectional images of the brain and shows only the structure of the brain, not its function. Image courtesy of the Yousef Mohammad, M.D., MSc; Assistant Professor of Neurology Division of Cerebrovascular Diseases, The Ohio State University Medical Center Positron Emission Tomography (PET) Image courtesy of the National Institute on Drug Abuse A scanner detects radioactive material that was injected or inhaled to produce an image of the brain. Commonly used radioactively-labeled material includes oxygen, fluorine, carbon and nitrogen. When this material gets into the bloodstream, it goes to areas of the brain that use it. So, oxygen and glucose accumulate in brain areas that are metabolically active. When the radioactive material breaks down, it gives off a neutron and a positron. When a positron hits an electron, both are destroyed and two gamma rays are released. Gamma ray detectors record the brain area where the gamma rays are emitted. This type of method provides a functional view of the brain. Advantages: 1. Provides an image of brain activity. Disadvantages: 1. Expensive to use. 2. Radioactive material used. MRI uses the detection of radiofrequency signals produced by displaced radio waves in a magnetic field. It provides an anatomical view of the brain. Advantages: Magnetic Resonance Imaging (MRI) 1. No X-rays or radioactive material is used. 2. Provides detailed view of the brain in different dimensions. 3. Safe, painless, non-invasive. 4. No special preparation (except the removal of all metal objects) is required from the patient. Patients can eat or drink anything before the procedure. Disadvantages: 1. Expensive to use. 2. Cannot be used in patients with metallic devices, like pacemakers. 3. Cannot be used with uncooperative patients because the patient must lie still. 4. Cannot be used with patients who are claustrophobic (afraid of small places). However, new MRI systems with a more open design are now available. Functional Magnetic Resonance Imaging (fMRI) Figure 1 Functional MRI detects changes in blood flow to particular areas of the brain. It provides both an anatomical and a functional view of the brain. A BOLD-based functional map during right finger and right toe movements, combined with head sketch. Since an oblique slice was selected along the left central sulcus, the left hemisphere is shown predominantly. An arrow indicates the left central sulcus. Yellow represents functional areas activated only during the finger movements; red, only during the toe movements; and green, during both tasks. (Kim et al., 1994a). Angiography involves a series of X-rays after dye is injected into the blood. This method provides an image of the blood vessels of the brain. Angiography Here are some examples of using a combination of PET and MRI techniques: Thalamus Cortex These 2 images show the averaged data from 14 subjects who received a painful injection of the chemical capsaicin into the upper arm. The colored part of the images show increased blood flow (the PET) to the thalamus and primary somatosensory cortex after the injection. The gray areas of the images (the MRI) show the brain anatomy. So using this method can identify the areas of the brain that are active during specific conditions. This technique could be used to study just about any other cognitive function. More re. Imaging Tome is Greek for slice. The standard slice orientation in most brain imaging is transaxial or "axial". Left is shown at right. Note that, like the "lower organs", we look up to the brain. Other standard planes of view are coronal and sagittal. Non-tomographic images represent "projections" from a single point of view and include bolus contrast x-ray angiograms and MR angiograms. Tomographic images are made up of little squares called "pixels" (picture elements), each of which takes a gray-scale value from 1 (black) to 256 (white). Each pixel represents brain tissue which is about 1 mm. on each of two sides. The thickness of the slice is often 3 or 5 mm, thus creating a three-dimensional volume element, or "voxel", which is shaped like a shoe box. Pixel intensity represents an average from tissue within the voxel. Image types CT (roentgen-ray computed tomography) A beam of x-rays is shot straight through the brain. As it comes out the other side, the beam is blunted slightly because it has hit dense living tissues on the way through. Blunting or "attenuation" of the x-ray comes from the density of the tissue encountered along the way. Very dense tissue like bone blocks lots of x-rays; gray matter blocks some and fluid even less. X-ray detectors positioned around the circumference of the scanner collect attenuation readings from multiple angles. A computerized algorithm reconstructs an image of each slice. MRI (magnetic resonance imaging) When protons (here brain protons) are placed in a magnetic field, they become capable of receiving and then transmitting electromagnetic energy. The strength of the transmitted energy is proportional to the number of protons in the tissue. Signal strength is modified by properties of each proton's microenvironment, such as its mobility and the local homogeneity of the magnetic field. MR signal can be "weighted" to accentuate some properties and not others. When an additional magnetic field is superimposed, one which is carefully varied in strength at different points in space, each point in space has a unique radio frequency at which the signal is received and transmitted. This makes constructing an image possible. It represents the spatial encoding of frequency, just like a piano. MR signal sources When protons are placed in a magnetic field, they oscillate. The frequency at which they oscillate depends on the strength of the magnetic field. Protons are capable of absorbing energy if exposed to electromagnetic energy at the frequency of oscillation. After they absorb energy, the nuclei release or reradiate this energy so that they return to their initial state of equilibrium. This reradiation or transmission of energy by the nuclei as they return to their initial state is what is observed as the MRI signal. The return of the nuclei to their equilibrium state does not take place instantaneously, but rather takes place over some time. The return of the nuclei to their initial state is governed by two physical processes: o the relaxation back to equilibrium of the component of the nuclear magnetization which is parallel to the magnetic field, and o the relaxation back to equilibrium of the component of the nuclear magnetization which is perpendicular to the magnetic field. The time that it takes for these two relaxation processes to take place is roughly equal to: o time T1 for the first process, and o time T2 for the second process. The strength of the MRI signal depends primarily on three parameters. o Density of protons in a tissue: The greater the density of protons, the larger the signal will be. o T1 o T2 The contrast between brain tissues is dependent upon how these 3 parameters differ between tissues. For most "soft" tissues in the body, the proton density is very homogeneous and therefore does not contribute in a major way to signal differences seen in a image. However, T1 and T2 can be dramatically different for different soft tissues, and these parameters are responsible for the major contrast between soft tissues. T1 and T2 are strongly influenced by the viscosity or rigidity of a tissue. Generally speaking, the greater the viscosity and rigidity, the smaller the value for T1 and T2. It is possible to manipulate the MR signal by changing the way in which the nuclei are initially subjected to electromagnetic energy. This manipulation can change the dependence of the observed signal on the three parameters: proton density, T1 and T2. Hence, one has a number of different MR imaging techniques ("weightings") to choose from, which accentuate some properties and not others. SPECT/PET (single photon/positron emission computed tomography) When radiolabeled compounds are injected in tracer amounts, their photon emissions can be detected much like x-rays in CT. The images made represent the accumulation of the labeled compound. The compound may reflect, for example, blood flow, oxygen or glucose metabolism, or dopamine transporter concentration. Often these images are shown with a color scale.

