Review
advertisement
FOM12
Chapter 7 Review
Multiple Choice
Identify the choice that best completes the statement or answers the question.
____
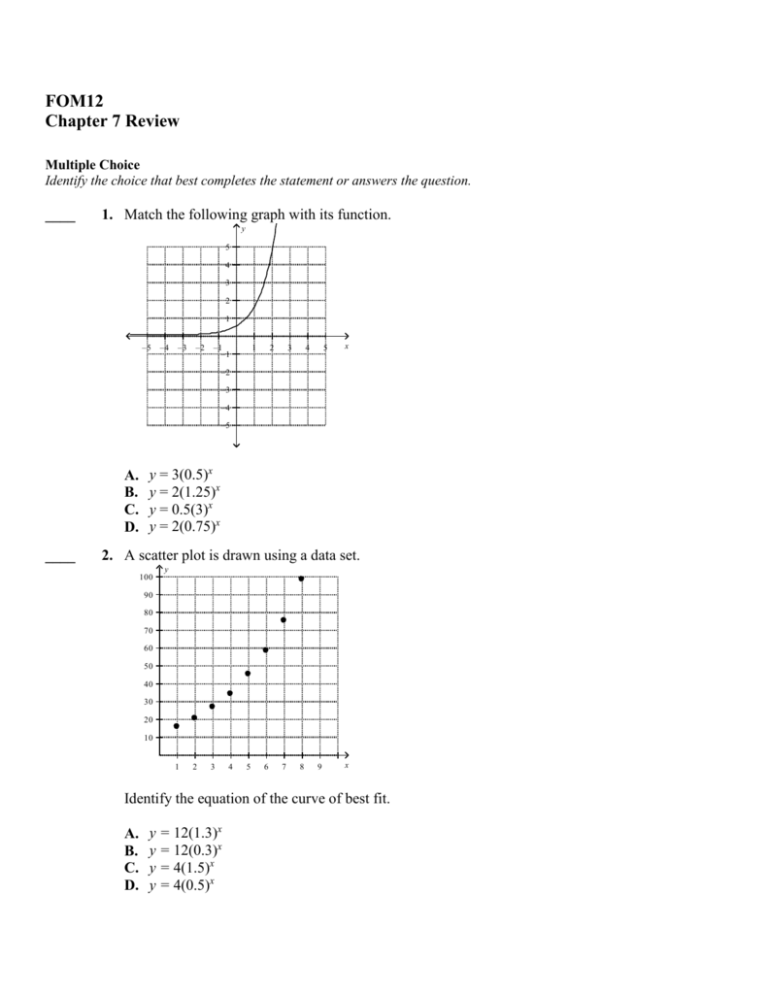
1. Match the following graph with its function.
y
5
4
3
2
1
–5
–4
–3
–2
–1
–1
1
2
3
4
5
x
–2
–3
–4
–5
A.
B.
C.
D.
____
y = 3(0.5)x
y = 2(1.25)x
y = 0.5(3)x
y = 2(0.75)x
2. A scatter plot is drawn using a data set.
100
y
90
80
70
60
50
40
30
20
10
1
2
3
4
5
6
7
8
9
x
Identify the equation of the curve of best fit.
A.
B.
C.
D.
y = 12(1.3)x
y = 12(0.3)x
y = 4(1.5)x
y = 4(0.5)x
____
3. A scatter plot is drawn using a data set.
10
y
9
8
7
6
5
4
3
2
1
1
2
3
4
5
6
7
8
9
x
Interpolate the value of y when x = 5.
A.
B.
C.
D.
____
4. Predict the x-intercept of f(x) = 10 log x.
A.
B.
C.
D.
____
3.8
2.9
2.5
2.0
–1
0
1
10
5. Predict the x-intercept of f(x) = –
ln x.
A. –1
B. 0
C. 1
D.
–
____
6. Which function will have the fastest increase in the y-values?
A.
y=
log x
B. y = 3 log x
C.
y = – log x
D. y = –5 log x
____
7. Which function will have the fastest decrease in the y-values?
A.
y=–
ln x
B. y = –2 ln x
C. y = –ln x
D. y = –1.5 ln x
____
8. Which exponential equation correctly represents the logarithmic equation y = log 50?
A.
B.
C.
D.
____
9. The equation of the logarithmic function that models a data set is y = 8.2 + 0.7 ln x.
Interpolate the value of y when x = 5.5.
A.
B.
C.
D.
____
{y | y R}
{y | y > 0, y R}
{y | y < 43.9, y R}
{y | y > –8.7, y R}
11. Determine the equation of the logarithmic regression function for the data.
x
3
4
5
6
8
y
2.1
4.6
6.5
8.0
10.5
A.
B.
C.
D.
____
y = 8.8
y = 9.4
y = 9.9
y = 11.1
10. The equation of the logarithmic function that models a data set is y = 43.9 – 8.7 ln x.
Determine the range of this function.
A.
B.
C.
D.
____
50y = 10
10y = 50
y50 = 10
y10 = 50
y = –6.27 + 8.54 ln x
y = –7.26 + 7.54 ln x
y = –6.27 + 7.54 ln x
y = –7.26 + 8.54 ln x
12. Determine the equation of the logarithmic regression function for the data.
x
5
10
15
20
25
y
96.0
94.2
93.2
92.5
92.0
A.
B.
C.
D.
10
12.4
y = 98 – 2.0 ln x
y = 99 – 2.3 ln x
y = 100 – 2.5 ln x
y = 101 – 2.8 ln x
30
91.5
____
13. A scatter plot is drawn using a data set. Identify the equation of the curve of best fit.
10
y
9
8
7
6
5
4
3
2
1
1
A.
B.
C.
D.
2
3
4
5
6
7
8
9
x
y = 8.5 + log x
y = 8.5 + ln x
y = 8.5 log x
y = 8.5 ln x
Problem
1. The frequency of the notes on a piano grow exponentially. A piano tuner measures the frequency
of the sound generated by six keys and records them in a table.
C
D
E
F
G
A
Note
Semitones
0
2
4
5
7
9
Above Middle C
262
293
330
352
395
440
Frequency (Hz)
a) Use exponential regression to model the frequency. Round all values to the nearest hundredth.
b) Estimate the frequency of D#, which is between D and E, to the nearest Hertz. Show your work.
c) Estimate the frequency of the next C, which is 12 semitones above middle C, to the nearest
Hertz. Show your work.
2. The population of frogs in a marsh was recorded for several years.
1
2
3
4
5
6
Year
185
197
208
215
219
221
Number of Frogs
7
226
a) Create a scatter plot, and draw a curve of best fit
for the data using logarithmic regression.
b) Use your graph to estimate how the frog population
will increase from the 7th to the 10th year.
3. Which exponential function matches each graph below?
Provide your reasoning.
i)
iii)
iv)
ii)
a)
b)
y
–5
–4
–3
–2
y
5
5
4
4
3
3
2
2
1
1
–1
–1
1
2
3
4
5
x
–5
–4
–3
–2
–1
–1
–2
–2
–3
–3
–4
–4
–5
–5
1
2
3
4
5
x
4. Use what you know about the exponential function
to predict the number of x-intercepts,
the y-intercept, the end behaviour, the domain, and the range of the following function:
FOM12 Chapter 7 Test A
Answer Section
MULTIPLE CHOICE
1
2
3
4
5
6
7
8
9
10
11
12
13
C
A
B
C
C
B
B
B
B
A
D
C
C
PROBLEM
1.
a) I used a spreadsheet to determine the equation of the exponential regression function:
y = 261.84(1.06)x
where y is the frequency in Hertz and x is the number of semitones above middle C.
b) Since D# is one semitone above D, x = 3.
y = 261.84(1.06)x
y = 261.84(1.06)3
y = 311.855...
The frequency of D# is 312 Hz.
c) When x = 12:
y = 261.84(1.06)x
y = 261.84(1.06)12
y = 526.873...
The frequency of the next C is 527 Hz.
2.
a)
b)
b)
Using the curve of best fit, the frog population in the 10th year is about 233.
233 – 226 = 7
The frog population will increase by about 7 from the 7th to the 10th year.
3.
Graph a) is increasing and has a y-intercept of 4. That means it must have b > 1 and a = 4.
The only function with those characteristics is
.
Graph b) is a decreasing function and has a y-intercept of 2. That means it must have
0 < b < 1 and a = 2.
The only function with those characteristics is
.
a) i
b) iii
4.
The function
has the same increasing shape as the function
, but is 1 unit lower on the y-axis. That means that
will start in quadrant III before crossing the x-axis. The curve will extend into quadrant I.
y-intercept: 0
The graph crosses both axes at the origin.
Number of x-intercepts: 1
End behaviour: The curve extends from quadrant III to quadrant I.
Domain: {x | x R}
The range will be 1 unit less than the range of the original function.
Range: {y | y > –1, y R}


