Calculating flow properties
advertisement
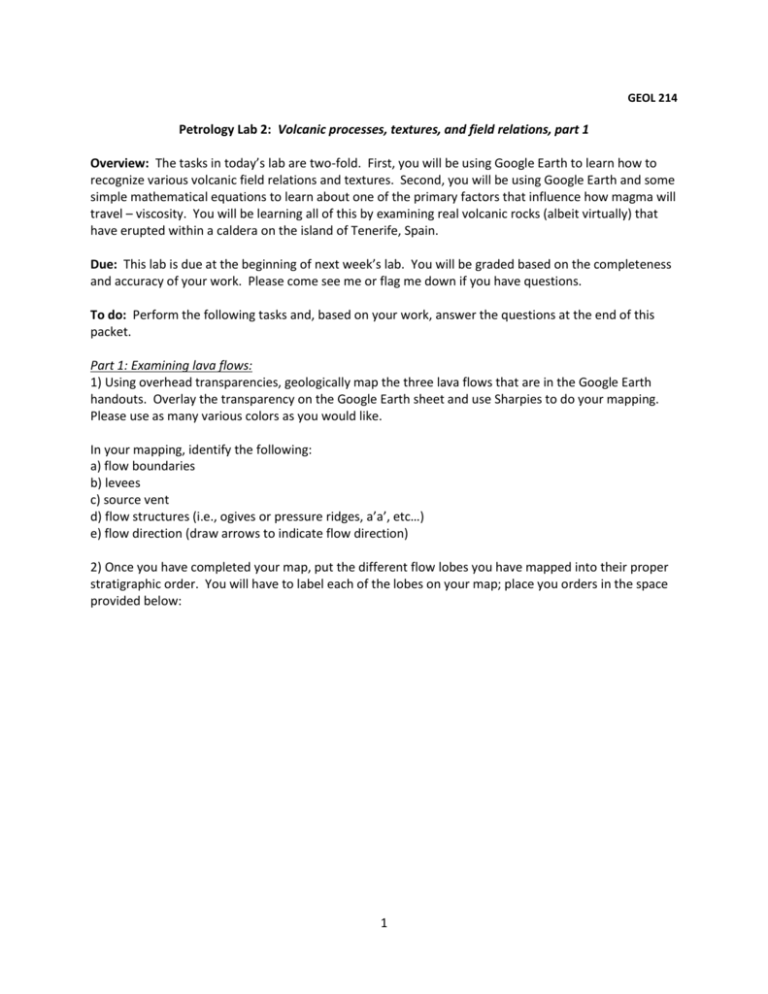
GEOL 214 Petrology Lab 2: Volcanic processes, textures, and field relations, part 1 Overview: The tasks in today’s lab are two-fold. First, you will be using Google Earth to learn how to recognize various volcanic field relations and textures. Second, you will be using Google Earth and some simple mathematical equations to learn about one of the primary factors that influence how magma will travel – viscosity. You will be learning all of this by examining real volcanic rocks (albeit virtually) that have erupted within a caldera on the island of Tenerife, Spain. Due: This lab is due at the beginning of next week’s lab. You will be graded based on the completeness and accuracy of your work. Please come see me or flag me down if you have questions. To do: Perform the following tasks and, based on your work, answer the questions at the end of this packet. Part 1: Examining lava flows: 1) Using overhead transparencies, geologically map the three lava flows that are in the Google Earth handouts. Overlay the transparency on the Google Earth sheet and use Sharpies to do your mapping. Please use as many various colors as you would like. In your mapping, identify the following: a) flow boundaries b) levees c) source vent d) flow structures (i.e., ogives or pressure ridges, a’a’, etc…) e) flow direction (draw arrows to indicate flow direction) 2) Once you have completed your map, put the different flow lobes you have mapped into their proper stratigraphic order. You will have to label each of the lobes on your map; place you orders in the space provided below: 1 3) Assume that you were able to collect samples from each of the three flows and were able to obtain the major oxide chemistry for each of the flows –presented below in the table. Major oxides (wt. %) SiO2 TiO2 Al2O3 Fe2O3 FeO MnO MgO CaO Na2O K2O P2O5 H2O CO2 S F Eruption temperature (degrees C) Flow A 55.74 0.85 18.26 1.51 4.63 0.25 1.01 2.57 8.53 4.82 0.41 0.36 0.02 0.04 0.15 ~900 Flow B 46.75 2.30 13.93 3.20 8.08 0.19 9.75 10.08 2.70 0.80 0.35 ~1200 Based on these compositions, a) What is the composition of each flow (as plotted on a TAS diagram)? Flow A:________________________________________ Flow B:________________________________________ Flow C:________________________________________ b) What minerals and textures would you predict each flow to have? Flow A:________________________________________ Flow B:________________________________________ Flow C:________________________________________ 2 Flow C 65.02 0.36 14.88 1.75 3.48 0.13 0.04 1.34 5.90 4.30 0.04 ~1000 Part 2: Bringing things together 4) Go back to your map and bring up Google Earth on your computer. a) Using the ruler function in Google Earth, calculate the volume of each of your three flows and list them in the space below. b) Assuming that flows a and c each had a volumetric effusion rate of ~7 m3/s, how long did it take to emplace each of the flows? Be sure to show your work below. c) Assuming that flow b had a volumetric effusion rate of ~100 m3/s, how long did it take to emplace this flow? Be sure to show your work below. 3 5) Using the following equation, calculate the viscosity of each of the flows: = ( g sin d2) / (3 v) This equation is known as Jeffrey’s Equation and is used for calculating the viscosity of a fluid in a channel. Be sure to show your work below. 6) Based on your work from above, what is the greatest factor in controlling a magma’s viscosity? 7) What are some other factors that may also play a role in controlling a magma’s viscosity? 4
