How to generate your matrices:
advertisement
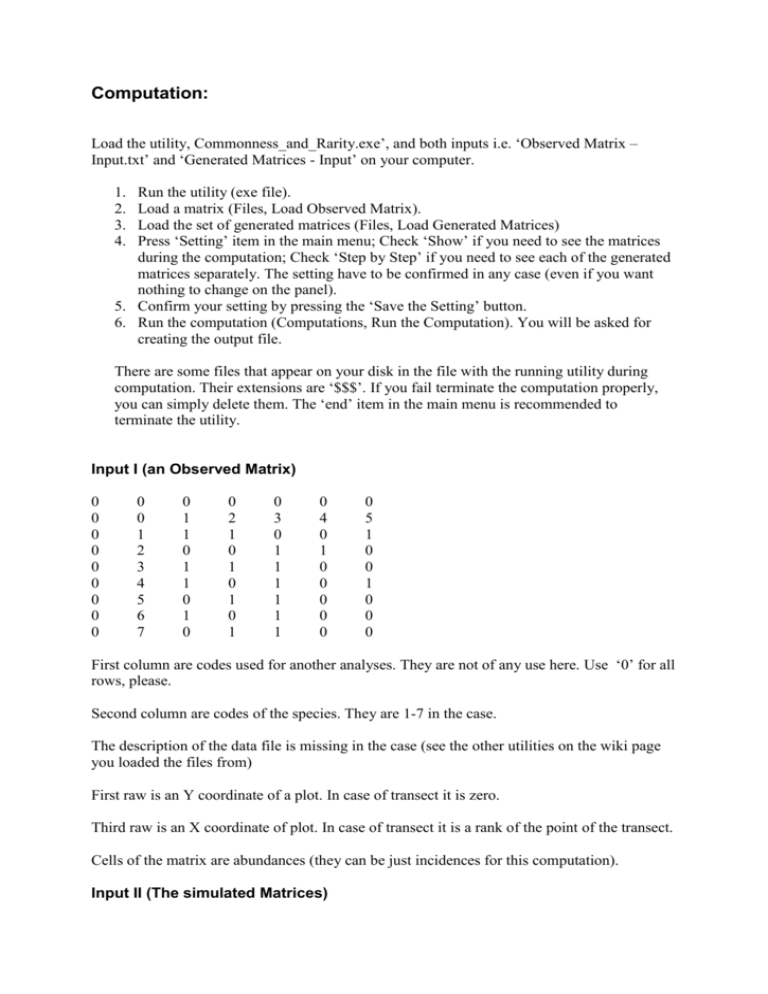
Computation: Load the utility, Commonness_and_Rarity.exe’, and both inputs i.e. ‘Observed Matrix – Input.txt’ and ‘Generated Matrices - Input’ on your computer. 1. 2. 3. 4. Run the utility (exe file). Load a matrix (Files, Load Observed Matrix). Load the set of generated matrices (Files, Load Generated Matrices) Press ‘Setting’ item in the main menu; Check ‘Show’ if you need to see the matrices during the computation; Check ‘Step by Step’ if you need to see each of the generated matrices separately. The setting have to be confirmed in any case (even if you want nothing to change on the panel). 5. Confirm your setting by pressing the ‘Save the Setting’ button. 6. Run the computation (Computations, Run the Computation). You will be asked for creating the output file. There are some files that appear on your disk in the file with the running utility during computation. Their extensions are ‘$$$’. If you fail terminate the computation properly, you can simply delete them. The ‘end’ item in the main menu is recommended to terminate the utility. Input I (an Observed Matrix) 0 0 0 0 0 0 0 0 0 0 0 1 2 3 4 5 6 7 0 1 1 0 1 1 0 1 0 0 2 1 0 1 0 1 0 1 0 3 0 1 1 1 1 1 1 0 4 0 1 0 0 0 0 0 0 5 1 0 0 1 0 0 0 First column are codes used for another analyses. They are not of any use here. Use ‘0’ for all rows, please. Second column are codes of the species. They are 1-7 in the case. The description of the data file is missing in the case (see the other utilities on the wiki page you loaded the files from) First raw is an Y coordinate of a plot. In case of transect it is zero. Third raw is an X coordinate of plot. In case of transect it is a rank of the point of the transect. Cells of the matrix are abundances (they can be just incidences for this computation). Input II (The simulated Matrices) The input is identical to the output from the utility ‘matrices_generator.exe’. The first number is compulsory; it shows the number of rows (species in the case) of each consecutive matrix in the file (radku bez hlavicky=rows without a headline); (The text after the number is just information, can be modified deliberately) 7 radku bez hlavicky 0 0 0 0 0 1 0 1 0 0 2 0 0 3 0 0 4 0 0 5 0 0 6 0 0 7 0 0 0 0 0 0 1 0 1 0 0 2 0 0 3 1 0 4 0 0 5 0 0 6 0 0 7 1 0 0 0 0 0 1 0 1 0 0 2 0 0 3 1 0 4 0 0 5 0 0 6 0 0 7 0 0 0 0 0 0 1 0 1 0 0 2 0 0 3 0 0 4 0 0 5 0 0 6 0 0 7 0 0 0 0 0 0 1 0 1 0 0 2 0 0 3 0 0 4 0 0 5 0 0 2 0 0 1 0 1 1 0 0 2 0 0 0 0 1 0 0 0 2 0 0 0 0 1 0 0 0 2 0 0 0 0 1 1 0 0 2 0 0 1 0 0 0 3 1 1 0 1 0 1 1 0 3 1 1 0 1 0 1 1 0 3 1 1 0 1 1 1 1 0 3 1 1 0 1 0 1 1 0 3 0 0 0 0 1 0 4 0 0 0 0 0 0 1 0 4 0 0 0 0 1 1 0 0 4 0 0 0 1 1 1 1 0 4 0 0 1 1 1 0 1 0 4 1 1 0 1 1 0 5 1 1 1 1 1 1 1 0 5 1 1 1 1 1 1 1 0 5 1 1 1 1 0 1 1 0 5 1 1 1 1 1 1 1 0 5 0 1 1 1 1 0 0 6 7 0 0 1 1 1 0 1 1 0 1 Output The output is a table comprising the following list of items (labeled according to the paper) Simulation Focal Species Occupancy Sum of D_j r-Nestedness D_s Max D_s Correlation Max Correlation rNestedness Sim rNestedness Obs D_s Sim D_s Obs Correlation Sim Correlation Obs Numerator Sim Numerator Obs
