MS Word - Land Surface Hydrology Group, Princeton University
advertisement
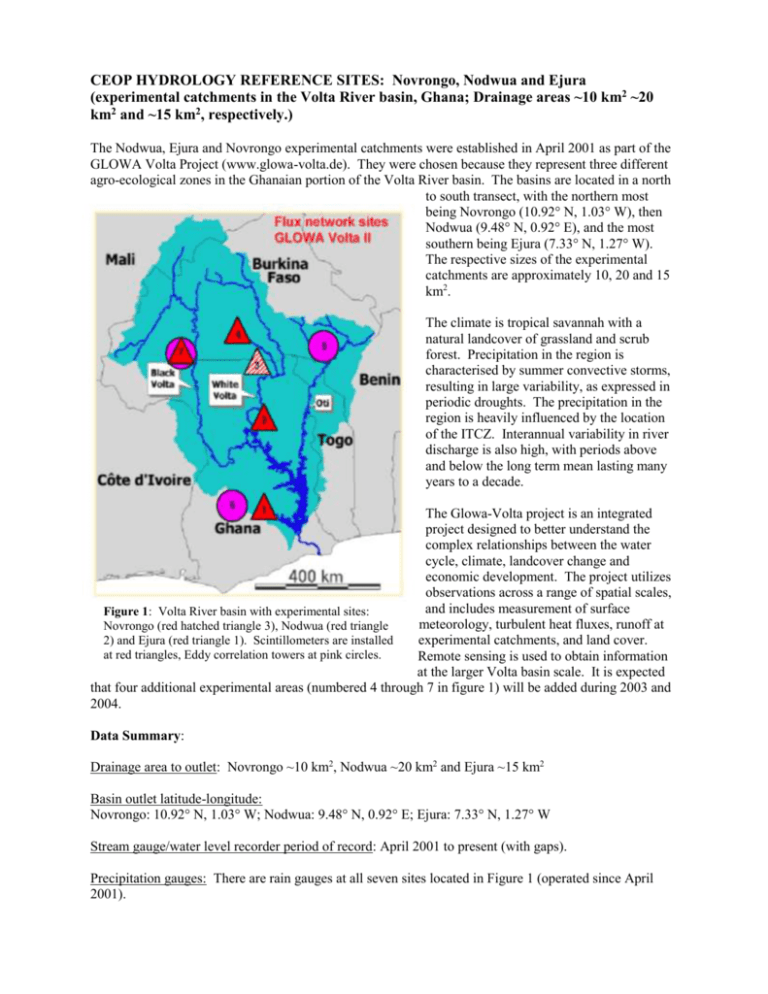
CEOP HYDROLOGY REFERENCE SITES: Novrongo, Nodwua and Ejura (experimental catchments in the Volta River basin, Ghana; Drainage areas ~10 km2 ~20 km2 and ~15 km2, respectively.) The Nodwua, Ejura and Novrongo experimental catchments were established in April 2001 as part of the GLOWA Volta Project (www.glowa-volta.de). They were chosen because they represent three different agro-ecological zones in the Ghanaian portion of the Volta River basin. The basins are located in a north to south transect, with the northern most being Novrongo (10.92° N, 1.03° W), then Nodwua (9.48° N, 0.92° E), and the most southern being Ejura (7.33° N, 1.27° W). The respective sizes of the experimental catchments are approximately 10, 20 and 15 km2. The climate is tropical savannah with a natural landcover of grassland and scrub forest. Precipitation in the region is characterised by summer convective storms, resulting in large variability, as expressed in periodic droughts. The precipitation in the region is heavily influenced by the location of the ITCZ. Interannual variability in river discharge is also high, with periods above and below the long term mean lasting many years to a decade. The Glowa-Volta project is an integrated project designed to better understand the complex relationships between the water cycle, climate, landcover change and economic development. The project utilizes observations across a range of spatial scales, and includes measurement of surface Figure 1: Volta River basin with experimental sites: meteorology, turbulent heat fluxes, runoff at Novrongo (red hatched triangle 3), Nodwua (red triangle 2) and Ejura (red triangle 1). Scintillometers are installed experimental catchments, and land cover. at red triangles, Eddy correlation towers at pink circles. Remote sensing is used to obtain information at the larger Volta basin scale. It is expected that four additional experimental areas (numbered 4 through 7 in figure 1) will be added during 2003 and 2004. Data Summary: Drainage area to outlet: Novrongo ~10 km2, Nodwua ~20 km2 and Ejura ~15 km2 Basin outlet latitude-longitude: Novrongo: 10.92° N, 1.03° W; Nodwua: 9.48° N, 0.92° E; Ejura: 7.33° N, 1.27° W Stream gauge/water level recorder period of record: April 2001 to present (with gaps). Precipitation gauges: There are rain gauges at all seven sites located in Figure 1 (operated since April 2001). Micrometeorological data: Novrongo: Net radiation downward solar and downward longwave. Air temperature, relative humidity, pressure, and precipitation. Period of record April 2001 to date; Nodwua: Net radiation downward solar, downward longwave, upward shortwave, upward longwave. Air temperature, relative humidity, pressure, dew point and precipitation. Period of record April 2001 to date (with some gaps); Ejura: Net radiation. Air temperature, relative humidity, wind speed/direction, and precipitation Turbulent flux measurements: Novrongo: Turbulent flux measurement takes place with Scintillometers, sensible heat only (2001present with some gaps). Instrumentation will be moved to another site in 2004; Nodwua: Turbulent flux measurement takes place with Scintillometers, sensible heat only (2001-present with some gaps). Eddy correlation during some campaigns; Ejura: Turbulent flux measurement takes place with Scintillometers, sensible heat only (2001-present with some gaps). Soil moisture: Novrongo: Soil moisture with Delta-T Probe(10, 20,30,40,60,100 cm) at weekly time intervals; Nodwua: Soil moisture with Delta-T Probe(10, 20,30,40,60,100 cm); Ejura: Soil moisture has been measured, but no details available. Other measurements: Novrongo: Surface radiometric temperature (field campaign observations, but permanent instrument to be installed in 2003, detailed landcover classification; Nodwua: Ground heat flux using Hukseflux plate (2001-present with some gaps), tree density CO2 measurements (campaigns), PAR, landcover classifications, species characterization, soils (particle size distribution, hydraulic conductivity, organic matter, pH; Ejura: Albedo, ground heat flux using Hukseflux plate (2001-Present with some gaps), tree density event based runoff measurements and infiltration measurements have been taken in field plots various soil parameters such as particle size distribution, hydraulic conductivity, organic matter. Contact: Nick van de Giesen (nick@uni-bonn.de)
