Countries Comparison Assignment 2014
advertisement
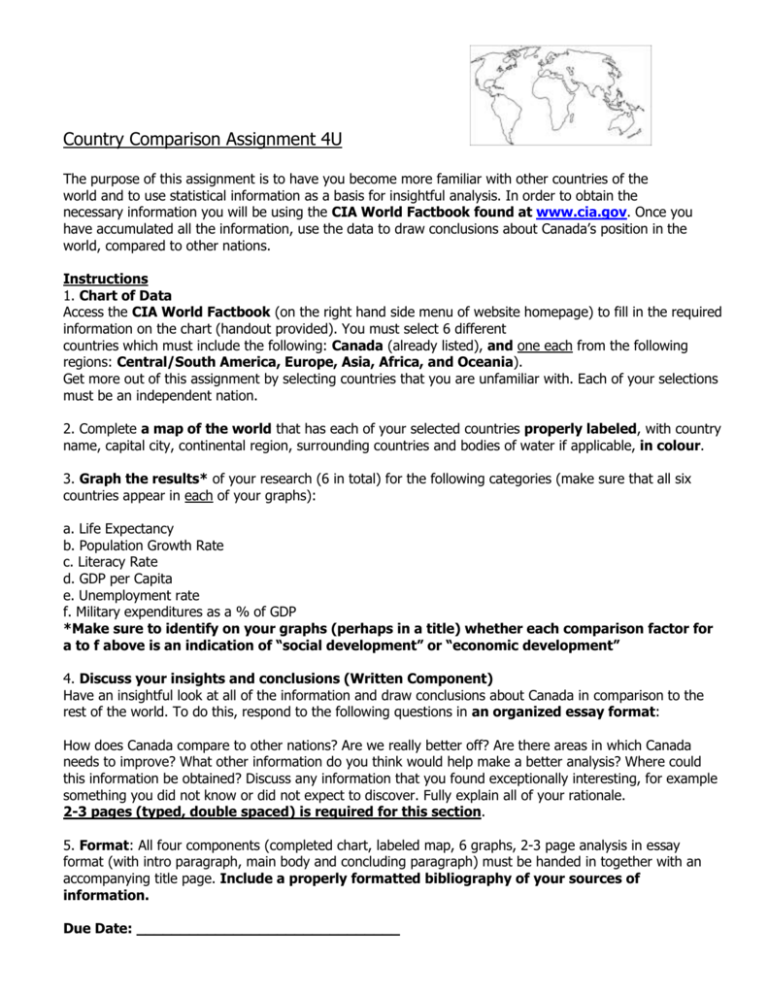
Country Comparison Assignment 4U The purpose of this assignment is to have you become more familiar with other countries of the world and to use statistical information as a basis for insightful analysis. In order to obtain the necessary information you will be using the CIA World Factbook found at www.cia.gov. Once you have accumulated all the information, use the data to draw conclusions about Canada’s position in the world, compared to other nations. Instructions 1. Chart of Data Access the CIA World Factbook (on the right hand side menu of website homepage) to fill in the required information on the chart (handout provided). You must select 6 different countries which must include the following: Canada (already listed), and one each from the following regions: Central/South America, Europe, Asia, Africa, and Oceania). Get more out of this assignment by selecting countries that you are unfamiliar with. Each of your selections must be an independent nation. 2. Complete a map of the world that has each of your selected countries properly labeled, with country name, capital city, continental region, surrounding countries and bodies of water if applicable, in colour. 3. Graph the results* of your research (6 in total) for the following categories (make sure that all six countries appear in each of your graphs): a. Life Expectancy b. Population Growth Rate c. Literacy Rate d. GDP per Capita e. Unemployment rate f. Military expenditures as a % of GDP *Make sure to identify on your graphs (perhaps in a title) whether each comparison factor for a to f above is an indication of “social development” or “economic development” 4. Discuss your insights and conclusions (Written Component) Have an insightful look at all of the information and draw conclusions about Canada in comparison to the rest of the world. To do this, respond to the following questions in an organized essay format: How does Canada compare to other nations? Are we really better off? Are there areas in which Canada needs to improve? What other information do you think would help make a better analysis? Where could this information be obtained? Discuss any information that you found exceptionally interesting, for example something you did not know or did not expect to discover. Fully explain all of your rationale. 2-3 pages (typed, double spaced) is required for this section. 5. Format: All four components (completed chart, labeled map, 6 graphs, 2-3 page analysis in essay format (with intro paragraph, main body and concluding paragraph) must be handed in together with an accompanying title page. Include a properly formatted bibliography of your sources of information. Due Date: ______________________________ Countries Comparison Chart Location Area (sq km) Natural Resources Environmental Issues Population Growth Rate Life Expectancy Ethnic Groups Religions Languages Literacy Rate School Life Expectancy Government Type Canada North Latin Europe America America Asia Africa Oceania Location GDP per Capita Household Income Unemployment Rate Major Industries External Debt Internet Users Telephone Mobile Users Radio Stations Television Channels Military Age and Obligation Military Expenditure (% of GDP) Transnational Issues Canada North Latin Europe America America Asia Africa Oceania Name: ____________________________________ Criteria/Level Knowledge and Understanding Student demonstrate ability to understand what different values mean when comparing and interpreting countries as revealed through analysis of data. Thinking and Inquiry Student’s analysis of comparison data is insightful and thorough. Connections are made about how various criteria reveal the state and nature (or lack thereof) of a country in terms of its social, economic and cultural qualities Communication Student communicates graphed data clearly and effectively and with all required labels and values. Student communicates analysis and connections clearly and with few mechanical and grammatical errors. Application Student is thorough and accurate in completing the chart of researched data and in applying necessary information of chosen countries to the world map. Map includes STABLED criteria and is in colour. K/U: ____ I Rubric: Country Comparison Assignment RR R+ Student does not demonstrate a basic knowledge and understanding of comparison criteria 11 1+ Student demonstrates only a basic knowledge and understanding of comparison criteria 22 2+ Student demonstrates some knowledge and understanding of comparison criteria 33 3+ Student demonstrates an expected level of knowledge and understanding of comparison criteria Analysis is too brief, incomplete and inconclusive, but an attempt was made. Analysis is superficial and demonstrates meeting a minimal skill level. Analysis is somewhat clear and demonstrates meeting some of the expected skill level. Analysis is clear and conclusive and demonstrates meeting the expected skill level. Graphed data is unclear, ineffective and incomplete but an effort was made. Mechanical and grammatical errors are found throughout analysis. Graphed data is not as effective as expected in order to communicate information. Many mechanical and grammatical errors are found throughout analysis. Data chart is complete but difficult to read and as such is not so effective, map is also messy and does not communicate county identification well. Most STABLED criteria is missing. Graphed data is somewhat effective in communicating information. Some mechanical and grammatical errors are found in analysis. Graphed data is effective in communicating information. Few mechanical and grammatical errors are found in analysis. Data chart is complete but not as accurate as it should be, map is a bit messy and does not communicate county identification very effectively. Most STABLED criteria is present. A: ____ Data chart is complete and accurate, map is complete and appropriately communicates county identification. All expected STABLED criteria is present. Data chart is only partially complete, many blanks are found, map is also ineffective in communicating county identification. Little to no STABLED criteria visible. T/I: ____ C: ____ Name: ____________________________________ Criteria/Level Knowledge and Understanding Student demonstrate ability to understand what different values mean when comparing and interpreting countries as revealed through analysis of data. Thinking and Inquiry Student’s analysis of comparison data is insightful and thorough. Connections are made about how various criteria reveal the state and nature (or lack thereof) of a country in terms of its social, economic and cultural qualities Communication Student communicates graphed data clearly and effectively and with all required labels and values. Student communicates analysis and connections clearly and with few mechanical and grammatical errors. Application Student is thorough and accurate in completing the chart of researched data and in applying necessary information of chosen countries to the world map. Map includes STABLED criteria and is in colour. K/U: ____ T/I: ____ I Date: ____________________ Rubric: Country Comparison Assignment 11 1+ Student demonstrates only a basic knowledge and understanding of comparison criteria 22 2+ Student demonstrates some knowledge and understanding of comparison criteria 33 3+ Student demonstrates an expected level of knowledge and understanding of comparison criteria Analysis is too brief, incomplete and inconclusive, but an attempt was made. Analysis is superficial and demonstrates meeting a minimal skill level. Analysis is somewhat clear and demonstrates meeting some of the expected skill level. Analysis is clear and conclusive and demonstrates meeting the expected skill level. Graphed data is unclear, ineffective and incomplete but an effort was made. Mechanical and grammatical errors are found throughout analysis. Graphed data is not as effective as expected in order to communicate information. Many mechanical and grammatical errors are found throughout analysis. Data chart is complete but difficult to read and as such is not so effective, map is also messy and does not communicate county identification well. Most STABLED criteria is missing. Graphed data is somewhat effective in communicating information. Some mechanical and grammatical errors are found in analysis. Graphed data is effective in communicating information. Few mechanical and grammatical errors are found in analysis. Data chart is complete but not as accurate as it should be, map is a bit messy and does not communicate county identification very effectively. Most STABLED criteria is present. A: ____ Data chart is complete and accurate, map is complete and appropriately communicates county identification. All expected STABLED criteria is present. C: ____ Graphed data is very effective in communicating information. Few to no mechanical and grammatical errors are found in analysis. Data chart is complete and very accurate, map is complete and very effectively communicates county identification. All expected STABLED criteria is present. Date: ____________________ RR R+ Student does not demonstrate a basic knowledge and understanding of comparison criteria Data chart is only partially complete, many blanks are found, map is also ineffective in communicating county identification. Little to no STABLED criteria visible. 44 4+ Student demonstrates a superior level of expected knowledge and understanding of comparison criteria Analysis is clear, conclusive and very effective and demonstrates surpassing the expected skill level. 44 4+ Student demonstrates a superior level of expected knowledge and understanding of comparison criteria Analysis is clear, conclusive and very effective and demonstrates surpassing the expected skill level. Graphed data is very effective in communicating information. Few to no mechanical and grammatical errors are found in analysis. Data chart is complete and very accurate, map is complete and very effectively communicates county identification. All expected STABLED criteria is present. Country Comparison Assignment 4C The purpose of this assignment is to have you become more familiar with other countries of the world and to use statistical information as a basis for insightful analysis. In order to obtain the necessary information you will be using the CIA World Factbook found at www.cia.gov. Once you have accumulated all the information, use the data to draw conclusions about Canada’s position in the world, compared to other nations. Instructions 1. Chart of Data Access the CIA World Factbook (on the right hand side menu of website homepage) to fill in the required information on the chart (handout provided). You must select 6 different countries which must include the following: Canada (already listed), and one each from the following regions: Central/South America, Europe, Asia, Africa, and Oceania). Get more out of this assignment by selecting countries that you are unfamiliar with. Each of your selections must be an independent nation. 2. Complete a map of the world that has each of your selected countries properly labeled, with country name, capital city, continental region, surrounding countries and bodies of water if applicable, in colour. 3. Graph the results* of your research (5 in total) for the following categories (make sure that all six countries appear in each of your graphs): a. Life Expectancy b. Literacy Rate c. GDP per Capita d. Unemployment rate e. Military expenditures as a % of GDP *Make sure to identify on your graphs (perhaps in a title) whether each comparison factor for a to e above is an indication of “social development” or “economic development” 4. Discuss your insights and conclusions (Written Component) Have an insightful look at all of the information and draw conclusions about Canada in comparison to the rest of the world. To do this, respond to the following questions in an organized essay format: How does Canada compare to other nations? Are we really better off? Are there areas in which Canada needs to improve? What other information do you think would help make a better analysis? Discuss any information that you found exceptionally interesting, for example something you did not know or did not expect to discover. Fully explain all of your rationale. 2-3 pages (typed, double spaced) is required for this section. 5. Format: All four components (completed chart, labeled map, 5 graphs, 2-3 page analysis in essay format (with intro paragraph, main body and concluding paragraph) must be handed in together with an accompanying title. Include a properly formatted bibliography of your sources of information. Due Date: ______________________________ Countries Comparison Chart Location Area (sq km) Natural Resources Environmental Issues Population Life Expectancy Ethnic Groups Religions Languages Literacy Rate School Life Expectancy Government Type Canada North Latin Europe America America Asia Africa Oceania Location GDP per Capita Unemployment Rate Major Industries External Debt Telephone Mobile Users Television Channels Military Age and Obligation Military Expenditure (% of GDP) Transnational Issues Canada North Latin Europe America America Asia Africa Oceania
