Drought Group Chapte..
advertisement
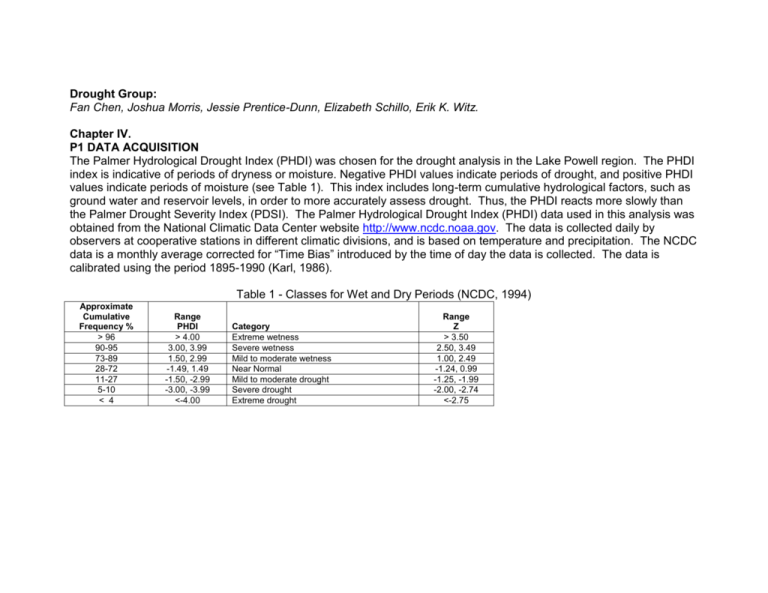
Drought Group: Fan Chen, Joshua Morris, Jessie Prentice-Dunn, Elizabeth Schillo, Erik K. Witz. Chapter IV. P1 DATA ACQUISITION The Palmer Hydrological Drought Index (PHDI) was chosen for the drought analysis in the Lake Powell region. The PHDI index is indicative of periods of dryness or moisture. Negative PHDI values indicate periods of drought, and positive PHDI values indicate periods of moisture (see Table 1). This index includes long-term cumulative hydrological factors, such as ground water and reservoir levels, in order to more accurately assess drought. Thus, the PHDI reacts more slowly than the Palmer Drought Severity Index (PDSI). The Palmer Hydrological Drought Index (PHDI) data used in this analysis was obtained from the National Climatic Data Center website http://www.ncdc.noaa.gov. The data is collected daily by observers at cooperative stations in different climatic divisions, and is based on temperature and precipitation. The NCDC data is a monthly average corrected for “Time Bias” introduced by the time of day the data is collected. The data is calibrated using the period 1895-1990 (Karl, 1986). Table 1 - Classes for Wet and Dry Periods (NCDC, 1994) Approximate Cumulative Frequency % > 96 90-95 73-89 28-72 11-27 5-10 < 4 Range PHDI > 4.00 3.00, 3.99 1.50, 2.99 -1.49, 1.49 -1.50, -2.99 -3.00, -3.99 <-4.00 Category Extreme wetness Severe wetness Mild to moderate wetness Near Normal Mild to moderate drought Severe drought Extreme drought Range Z > 3.50 2.50, 3.49 1.00, 2.49 -1.24, 0.99 -1.25, -1.99 -2.00, -2.74 <-2.75 P2-P3 ANALYSIS OF DATA The drought analysis was based on the monthly PHDI index for Utah climatic division 7 and Arizona climatic division 2 (the climatic divisions encompassing the Lake Powell region) for the years 1990 – 2004. Figure 1 shows the average PHDI for the two climatic divisions on a monthly basis from 1990 - 2004, with a 12 month moving average trend line. The chart shows three periods of extreme drought in 1996, 2000, and 2002. The most significant periods of moisture occurred in 1993 and 1995. The seasonal nature of the drought-like conditions can be seen in the chart with May-August being the most common months for these conditions. The trend since 1993 is towards increasing severity of drought with an almost continuous drought condition since 2001. Figure 2 is comprised of yearly averages of the PHDI index and highlights the differences between the Arizona and Utah climatic divisions. Again the 1996, 2000, and 2002 years are depicted as years of extreme drought. 1993, 1995 are shown as years of increased moisture for both climatic regions. The Arizona exhibits more extreme periods of drought than Utah, as well as generally more extreme periods of moisture. However, the Utah climate region is probably the most important for this analysis, as it comprises a greater portion of the river basins impacting Lake Powell. This figure also displays a trend of increasing drought since 1993. It is difficult to determine from this analysis whether drought conditions will continue or if they are part of a multi-decade cycle. The drought seems to have reached its peak in 2002, which (according to the NCDC) was the driest on record for Utah, and prompted the governor of Arizona to issue an executive order in 2003 establishing a drought task force. -8 1990-01 1990-04 1990-07 1990-10 1991-01 1991-04 1991-07 1991-10 1992-01 1992-04 1992-07 1992-10 1993-01 1993-04 1993-07 1993-10 1994-01 1994-04 1994-07 1994-10 1995-01 1995-04 1995-07 1995-10 1996-01 1996-04 1996-07 1996-10 1997-01 1997-04 1997-07 1997-10 1998-01 1998-04 1998-07 1998-10 1999-01 1999-04 1999-07 1999-10 2000-01 2000-04 2000-07 2000-10 2001-01 2001-04 2001-07 2001-10 2002-01 2002-04 2002-07 2002-10 2003-01 2003-04 2003-07 2003-10 2004-01 2004-04 2004-07 2004-10 PHDI Figure 1. PHDI Lake Powell Area 1990-2004 8 6 4 2 0 -2 -4 -6 Year-Month PHDI AZ 2 / UT 7 12 month mov. avg. (PHDI AZ 2 / UT 7) Figure 2. PHDI Lake Powell Area 1990-2000 Yearly Averages 8 6 4 PHDI 2 0 -2 Year PHDI AZ 2 PHDI UT 7 2004 2003 2002 2001 2000 1999 1998 1997 1996 1995 1994 1993 1992 1991 -6 1990 -4 References Arizona E.O. 2003-12: Arizona Drought Task Force Plan. Internet source: http://www.water.az.gov/gdtf/content/files/05082003/DroughtExecutiveOrder.pdf Karl, T.R., 1986: The sensitivity of the Palmer Drought Severity Index and Palmer's Z-Index to their calibration coefficients including potential evapotranspiration. J. Climate Appl. Meteor., 25, 77-86. Mauz, C., et al, 2000: Use and Management of Arid Lands: Vegetation, Fire and Climate History. Internet source: http://aria.arizona.edu/courses/arl642/grassbank2000/climate.html

