Aspirin_lab_using_CAChe
advertisement
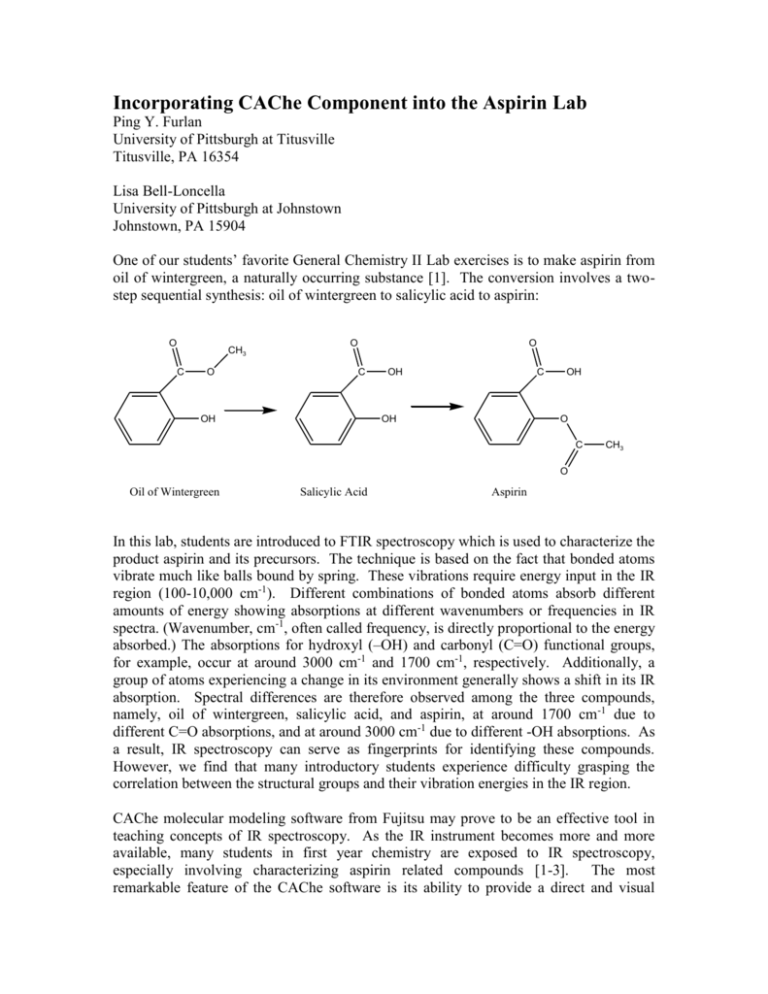
Incorporating CAChe Component into the Aspirin Lab Ping Y. Furlan University of Pittsburgh at Titusville Titusville, PA 16354 Lisa Bell-Loncella University of Pittsburgh at Johnstown Johnstown, PA 15904 One of our students’ favorite General Chemistry II Lab exercises is to make aspirin from oil of wintergreen, a naturally occurring substance [1]. The conversion involves a twostep sequential synthesis: oil of wintergreen to salicylic acid to aspirin: O CH3 C O O O C OH OH C OH OH O C CH3 O Oil of Wintergreen Salicylic Acid Aspirin In this lab, students are introduced to FTIR spectroscopy which is used to characterize the product aspirin and its precursors. The technique is based on the fact that bonded atoms vibrate much like balls bound by spring. These vibrations require energy input in the IR region (100-10,000 cm-1). Different combinations of bonded atoms absorb different amounts of energy showing absorptions at different wavenumbers or frequencies in IR spectra. (Wavenumber, cm-1, often called frequency, is directly proportional to the energy absorbed.) The absorptions for hydroxyl (–OH) and carbonyl (C=O) functional groups, for example, occur at around 3000 cm-1 and 1700 cm-1, respectively. Additionally, a group of atoms experiencing a change in its environment generally shows a shift in its IR absorption. Spectral differences are therefore observed among the three compounds, namely, oil of wintergreen, salicylic acid, and aspirin, at around 1700 cm-1 due to different C=O absorptions, and at around 3000 cm-1 due to different -OH absorptions. As a result, IR spectroscopy can serve as fingerprints for identifying these compounds. However, we find that many introductory students experience difficulty grasping the correlation between the structural groups and their vibration energies in the IR region. CAChe molecular modeling software from Fujitsu may prove to be an effective tool in teaching concepts of IR spectroscopy. As the IR instrument becomes more and more available, many students in first year chemistry are exposed to IR spectroscopy, especially involving characterizing aspirin related compounds [1-3]. The most remarkable feature of the CAChe software is its ability to provide a direct and visual correspondence between the IR peaks and the functional groups. The program runs fast and is user friendly. It also provides exposure to computational chemistry at the introductory level. In the Aspirin lab, we are interested in predicting the IR absorptions due to the carbonyl, C=O, and hydroxyl, OH, functional groups at around 1700 cm-1 and 3000 cm-1. The CAChe 6.1 Software package provides nine different quantum-mechanical methods for IR spectrum predictions: six MOPAC (Molecular Orbital Package) methods and three DFT (Density Function Theory) methods. The MOPAC is a semi empirical computing method. It optimizes the geometry and determines the IR transitions in a single experiment. The DFT method, on the other hand, is based on mathematical approximations. When using DFT methods, the geometry must be optimized first before computing the IR transitions. To compare these methods, eight small molecules (ethanol, 1-propanol, 1-dodecanol, phenol, acetone, 2-butanone, acetic acid, and ethyl acetate) containing the groups of interest along with oil of wintergreen, salicylic acid, and aspirin were used. Their IR spectra were compared with those predicted using different methods. It was found that different methods yielded quite different values and the relative errors ranged from 125% for the C=O group and 1-40% for the OH group. Within a given method, the calculation errors were observed to be systematic and the predicted wavenumbers were noted to be fairly fixed within a small range for a given functional group. Although the variation was small, the methods demonstrated sensitivity to the group’s surroundings, i.e., it was able to differentiate the absorptions of the same type of group surrounded by different environments. MOPAC PM5 seemed consistently to give better results although in many cases the predicted IR profiles were different from the observed ones. For both functional groups, the calculation errors using MOPAC PM5 method were under 10%. The MOPAC AM1 usually gave predictions fairly well for the OH absorptions in the 3000 cm -1 region and the profiles around the region were closer to the experimental ones. The standard procedure and the MOPAC PM3 yielded similar values, and the MOPAC MNDOd and PM3/Cl always gave too high values for both groups. The three DFT methods in general gave good predictions especially for C=O groups. However, the C=O peaks at around 1700 cm-1 often overlapped with C-H vibrations in the predicted spectra. Moreover, DFT methods require performing two experiments: the geometry optimization and the IR absorption computation. Each step was found to take a considerably long time to run, particularly when the molecule involved a benzene ring or became larger. Among the three DFT methods, the B88-LYP IR Spectrum gave the best prediction. It was believed that it would be valuable for the introductory students to run through different methods with small molecules and then select the better one to use for predicting their sample IR spectra. This experience would give them a chance to see that the calculations are based on different models which are not exact replicates of the reality. It would also show them that some models are better at predicting certain properties than others, and these results are capable of shining light into our understanding of the world of chemistry. In the first part of the lab, students will use CAChe to learn how different functional groups absorb IR energy at different frequencies. They will then be given a chance to compare different methods including MOPAC AM1, PM3, PM5 and B88-LYP DFT to see which results best match the experimental absorptions for the groups under study. Acetic acid, a small molecule containing both carbonyl and hydroxyl groups, can be used for this investigation. The typical results are shown in Table 1. O H3C C OH Acetic Acid Table1. Comparison of Experimental and Calculated IR Absorptions using Various Methods for Acetic Acid Acetic Acid C=O OH Experimental, cm-1 1717 3056 MOPAC AM1 cm-1 Error 22% 2088 11% 3431 MOPAC PM3 cm-1 Error 15% 1980 24% 3851 MOPAC PM5 cm-1 Error 6% 1827 1% 3097 B88-LYP DFT cm-1 Error 2% 1747 14% 3534 In this practice, students will first use the CAChe software to draw the acetic acid molecule and use the “comprehensive” command under “beautify” to optimize the 3-D structure. They will then save the file four times including the ending (AM1, PM3, PM5, LYP) on the name to signify the computation method being used. After computing each “IR transitions”, students can display both the molecule and the IR spectrum on the screen using the windows “tile” function. When students select a particular absorption on the spectrum, the atomic motions responsible for that absorption will be shown (See Figure1). Students should be able to quickly identify that C=O vibration occurs at 17002000 cm-1 and OH at 3000-4000 cm-1. They should also realize that calculations using MOPAC methods are very quick, usually done within a few seconds. On the other hand, the DFT method is much slower, taking about 3-5 minutes to finish even for this small molecule. From a simple error analysis, students can see that MOPAC PM5 method gives the predictions that best agree with the experimental ones within a time frame of a few seconds. Figure1 shows the 3-D structure (right) and the predicted IR spectrum (left) of acetic acid. The highlighted IR peak around 3400 cm-1corresponds to the indicated vibration of the OH group. Since students are expected to have performed an earlier activity on molecular structures and on the use of the CAChe software to draw molecules and optimize structures, this part of the lab should be done within 15-20 minutes. The second part of the lab is for students to build the three molecules involved in the aspirin synthesis lab, namely oil of wintergreen, salicylic acid, and aspirin. Students may build and beautify one molecule and save it three times using the name indicating the molecule being studied. They then modify and beautify the other two structures. After this, students will predict the IR transitions of each molecule using the MOPAC PM5 IR Spectrum procedure followed by analyzing and recording the IR peaks. They again should quickly comprehend that different OH groups and different C=O groups would absorb IR energy at slightly different frequencies. They should anticipate these peaks from the actual IR spectra of their samples. For instance, for aspirin they should expect two C=O peaks at around 1700 cm-1; one occurs at a slightly higher frequency due to the ester type C=O vibration and the other at a slightly lower frequency due to the acid type C=O vibration (See Figures 2a and 2b). The program runs fast, and the calculations should be done within 15-20 minutes. Figure 2a shows the predicted IR peak due to the ester type C=O vibration that occurs at 1845 cm-1. Figure 2b shows the predicted IR peak due to the acid type C=O vibration that occurs at 1819 cm-1. The last part of the lab is for students to obtain the actual IR spectra of the starting material (oil of wintergreen) and the two products they made (salicylic acid and aspirin). They will then match the predicted C=O and OH peaks with the observed ones to understand the origins of these peaks and to see if they have successfully converted their compounds. The typical experimental and calculated IR absorptions using MOPAC PM5 are listed in Table2. Table2. Experimental and Calculated IR Absorptions using MOPAC PM5 for the Listed Molecules Experimental, cm-1 Calculated, cm-1 Error Oil of Wintergreen C=O OH (ester) 1681 3188 C=O (acid) 1669 Salicylic Acid OH OH (acid) 3238 3017 1826 3109 1824 3108 9% 2% 9% 4% C=O (ester) 1754 Aspirin C=O (acid) 1693 OH (acid) 2971 3091 1845 1819 3087 2% 5% 7% 4% In conclusion, CAChe software can be incorporated into the Aspirin Synthesis and Characterization Lab easily and smoothly. The added component can be finished less than 30-40 minutes. The exercise will help the introductory students to understand how different structural groups absorb IR energy at different wavenumbers, how a subtle change in the group environment can result in a shift in its IR absorption, and how IR can be effectively used as fingerprints for compound identification. Additionally, it will provide the students an opportunity to be exposed to molecular modeling and computational chemistry at the introductory level. References 1. OlmsteadIII, J “Synthesis of Aspirin: A General Chemistry Experiment”, J. Chem. Educ. 1998, 75, 1261. 2. Byrd, Houston; O’Donnell, Stephen E. “A General Chemistry Laboratory Theme: Spectroscopic Analysis of Aspirin”, J. Chem. Educ. 2003, 80, 174. 3. Mirafzal, G. A.; Summer, J. M. “Microwave Irradiation Reactions: Synthesis of Analgesic Drugs”, J. Chem. Educ. 2000, 77, 356.
