Methods for Two Categorical Variables – R x C Tables In previous
advertisement
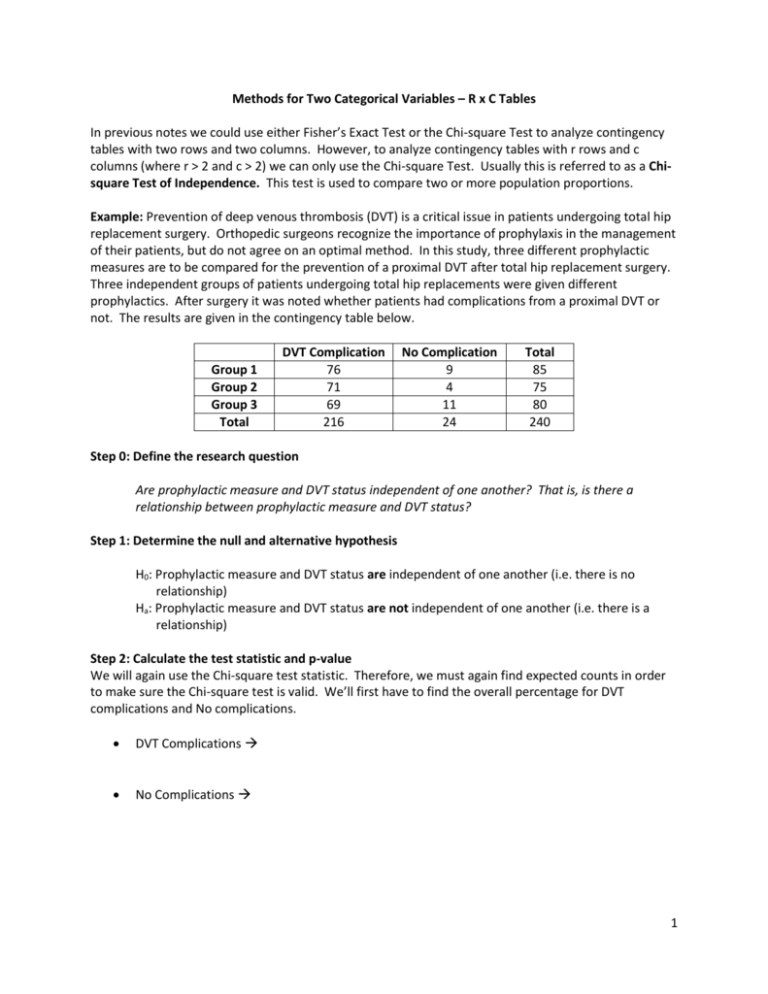
Methods for Two Categorical Variables – R x C Tables In previous notes we could use either Fisher’s Exact Test or the Chi-square Test to analyze contingency tables with two rows and two columns. However, to analyze contingency tables with r rows and c columns (where r > 2 and c > 2) we can only use the Chi-square Test. Usually this is referred to as a Chisquare Test of Independence. This test is used to compare two or more population proportions. Example: Prevention of deep venous thrombosis (DVT) is a critical issue in patients undergoing total hip replacement surgery. Orthopedic surgeons recognize the importance of prophylaxis in the management of their patients, but do not agree on an optimal method. In this study, three different prophylactic measures are to be compared for the prevention of a proximal DVT after total hip replacement surgery. Three independent groups of patients undergoing total hip replacements were given different prophylactics. After surgery it was noted whether patients had complications from a proximal DVT or not. The results are given in the contingency table below. Group 1 Group 2 Group 3 Total DVT Complication 76 71 69 216 No Complication 9 4 11 24 Total 85 75 80 240 Step 0: Define the research question Are prophylactic measure and DVT status independent of one another? That is, is there a relationship between prophylactic measure and DVT status? Step 1: Determine the null and alternative hypothesis H0: Prophylactic measure and DVT status are independent of one another (i.e. there is no relationship) Ha: Prophylactic measure and DVT status are not independent of one another (i.e. there is a relationship) Step 2: Calculate the test statistic and p-value We will again use the Chi-square test statistic. Therefore, we must again find expected counts in order to make sure the Chi-square test is valid. We’ll first have to find the overall percentage for DVT complications and No complications. DVT Complications No Complications 1 Once we have the overall percentages, we can find the expected counts for each cell in the contingency table. DVT Complication Group 1 Total 85 Group 2 75 Group 3 80 Total 216 No Complication 24 240 We can use JMP to find the test statistic and p-value. We’ll have to enter the data into JMP as follows: Then we’ll again choose Analyze Fit Y by X, and put Prophylactic Measure in for X, Factor and DVT Status in for Y, Response. You should then get the following output. You’ll again want to use the Pearson test statistic and p-value. Step 3: Report the conclusion in context of the research question. 2 We can also learn about the relationship between the two variables by looking at the mosaic plot. Example: A standardized procedure for determining a person’s susceptibility to hypnosis is the Stanford Hypnotic Scale, Form C (SHSS:C). Recently, a new method called the Computer-Assisted Hypnosis Scale (CAHS), which uses a computer as a facilitator of hypnosis, has been developed. Each scale classifies a person’s hypnotic susceptibility as low, medium, or high. Researchers at the University of Tennessee compared the two scales by administering both tests to each of 130 undergraduate volunteers (Psychological Assessment, March 1995). The hypnotic classifications are summarized in the contingency table given below. SHSS:C Level Low Medium High Total Low 32 11 6 49 CAHS Level Medium 14 14 16 44 High 2 6 29 37 Total 48 31 51 130 Questions: 1. Looking at the mosaic plot given below. Does is appear there is a relationship between SHSS:C level and CAHS level? Explain. 3 2. Carry out the hypothesis test to determine whether there is a relationship between SHSS:C level and CAHS level. Step 0: Define the research question Are SHSS:C level and CAHS level independent of one another? That is, is there a relationship between SHSS:C level and CAHS level? Step 1: Determine the null and alternative hypotheses Step 2: Calculate the test statistic and p-value Step 3: Report the conclusion in context of the research question 4 Example: Boles and Johnson (Journal of Addictive Diseases 2001) examined the beliefs held by adolescents regarding smoking and weight. Respondents characterized their weight into three categories: underweight, overweight, or appropriate. Smoking status was characterized according to the question “Do you currently smoke, meaning one or more cigarettes per day?” The data are given in the table below. Smoke Do Not Smoke Total Underweight 17 97 114 Overweight 25 142 167 Appropriate 96 816 912 Total 138 1055 1193 Questions: 3. Create a mosaic plot of the data. Looking at the mosaic plot, does it appear there is a relationship between an adolescent’s perception of weight and smoking status? Explain. 4. Carry out the hypothesis test to determine whether there is a relationship between perception of weight and smoking status. Step 0: Define the research question Are perception of weight and smoking status independent of each other? That is, is there a relationship between perception of weight and smoking status? Step 1: Determine the null and alternative hypotheses Step 2: Calculate the test statistic and p-value Step 3: Report the conclusion in context of the research question 5 Example: Gardemann et al. (1998) surveyed genotypes at an insertion/deletion polymorphism of the apolipoprotein B signal peptide in 2,259 men. The data are given in the following table. Ins/Ins Ins/Del Del/Del Total No Coronary Artery Disease 268 199 42 509 Coronary Artery Disease 807 759 184 1,750 Total 1,075 958 226 2,259 Questions: 5. Create a mosaic plot of the data. Looking at the mosaic plot, does it appear there is a relationship between apolipoprotein B signal peptide and coronary artery disease? Explain. 6. Carry out the hypothesis test to determine whether there is a relationship between apolipoprotein B signal peptide and coronary artery disease. Step 0: Define the research question Are apolipoprotein B signal peptide and coronary artery disease independent of each other? That is, is there a relationship between apolipoprotein B signal peptide and coronary artery disease? Step 1: Determine the null and alternative hypotheses Step 2: Calculate the test statistic and p-value 6 Step 3: Report the conclusion in context of the research question Example: A study was done to investigate the relationship between maternal drinking and congenital malformation. After the first three months of pregnancy, the women in the sample completed a questionnaire about alcohol consumption. Following childbirth, observations were recorded on presence of congenital sex organ malformations. The data are given in the contingency table below. Alcohol Consumption 0 <1 1–2 3–5 ≥6 Total Malformation Absent Present 17,066 48 14,464 38 788 5 126 1 37 1 32,481 93 Total 17,114 14,502 793 127 38 32,574 Questions: 7. Create a mosaic plot of the data. Looking at the mosaic plot, does it appear there is a relationship between day of the week and type of trap used? Explain. 8. Carry out the hypothesis test to determine whether there is a relationship between alcohol consumption and malformation status. Step 0: Define the research question Are alcohol consumption and malformation status independent of each other? That is, is there a relationship between alcohol consumption and malformation status? Step 1: Determine the null and alternative hypotheses 7 Step 2: Calculate the test statistic and p-value Step 3: Report the conclusion in context of the research question 8

