Active Materials by Four-Dimension (4D) Printing
Supplemental Online Material
Active Materials by Four-Dimension (4D) Printing
S1. Thermomechanical Behavior of the Matrix and Fibers
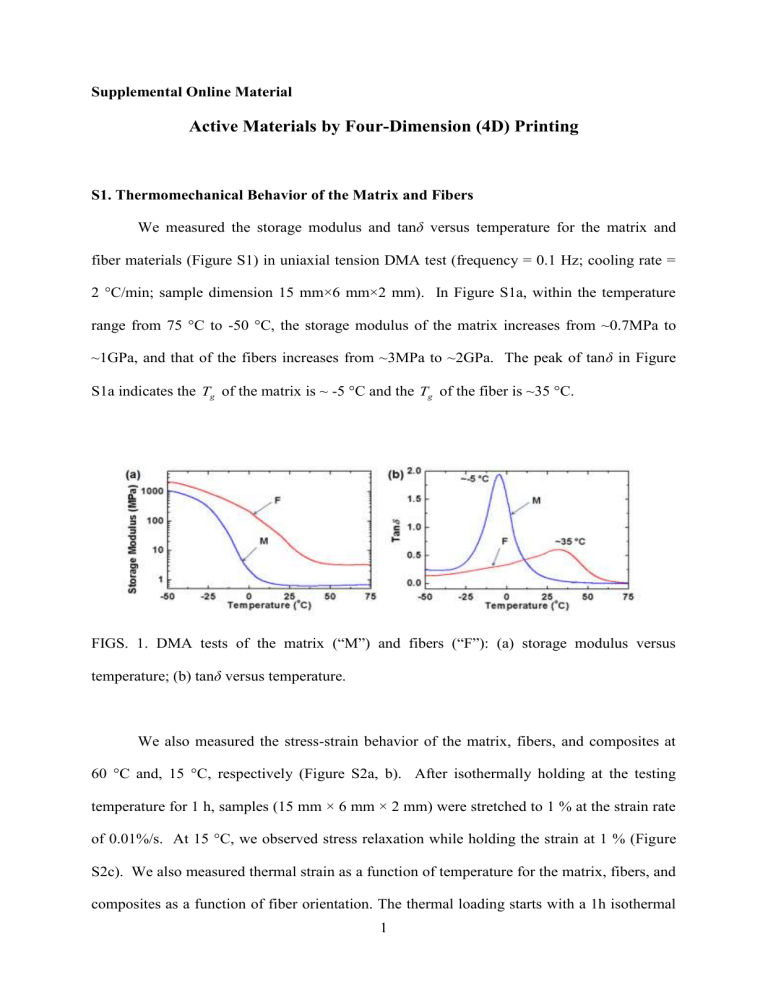
We measured the storage modulus and tan
δ
versus temperature for the matrix and fiber materials (Figure S1) in uniaxial tension DMA test (frequency = 0.1 Hz; cooling rate =
2 °C/min; sample dimension 15 mm×6 mm×2 mm). In Figure S1a, within the temperature range from 75 °C to -50 °C, the storage modulus of the matrix increases from ~0.7MPa to
~1GPa, and that of the fibers increases from ~3MPa to ~2GPa. The peak of tan δ in Figure
S1a indicates the T g
of the matrix is ~ -5 °C and the T g
of the fiber is ~35 °C.
FIGS. 1. DMA tests of the matrix (“M”) and fibers (“F”): (a) storage modulus versus temperature; (b) tan
δ
versus temperature.
We also measured the stress-strain behavior of the matrix, fibers, and composites at
60 °C and, 15 °C, respectively (Figure S2a, b). After isothermally holding at the testing temperature for 1 h, samples (15 mm × 6 mm × 2 mm) were stretched to 1 % at the strain rate of 0.01%/s. At 15 °C, we observed stress relaxation while holding the strain at 1 % (Figure
S2c). We also measured thermal strain as a function of temperature for the matrix, fibers, and composites as a function of fiber orientation. The thermal loading starts with a 1h isothermal
1
hold at 60 °C followed by cooling from 60 °C to 15 °C at a rate of 2 °C /min. In Figure S2d, thermal contraction for all the nine cases are nearly linear with the same coefficient of thermal expansion (
≈ 0.027%/°C).
FIGS. S2. Thermomechanical behavior of the matrix (M), fibers (F), and composites of various fiber orientations: stress-strain behavior at (a) 60 °C; and (b) 15 °C; (c) stress relaxation at 15 °C; (d) thermal strain versus temperature.
S2 – Theory for Nonlinear Elastic Behavior of Composites
Recently, Guo
1, 2
developed a hyperelastic constitutive model for anisotropic fiberreinforced composites, which treats both the matrix and fibers as neo-Hookean materials, and decomposes deformation into uniaxial deformation along the fiber and a subsequent shear deformation to estimate the strain energy. In the model, the strain energy stored in the composite system is:
W
1
2
a
I
1
3
1
2
b
I
4
I
4
1 2
3
, (S1)
2
and the corresponding Cauchy stress is
. (S2) with
a
1
1
v v f f
m
m
v v f f
f
f
m
and
b
1
v
f
m f
m
2 v v f v f
f
, where
m
and
f
are shear moduli of the matrix and the fibers, respectively; v m
and v f
are volume fractions of the matrix and the fibers and v m
v f
1 . Here,
F
is the deformation gradient =
where we use
X
to represent the position of a material particle in the original (undeformed) configuration, while x is the position of the corresponding particle in the current (deformed) configuration.
B
is the left Cauchy-Green deformation gradient and =
T . C is the right green Cauchy-Green deformation tensor and
T
C F F . I
1
and I
4
are the principal invariants of
C : I
1
tr C and I
4 a C a
0 0
F
2
, where a
0
is a unit vector that represents the fiber orientation of the reinforced fiber in the original (undeformed) configuration and
F
is the fiber stretch. In Eq. (S2), p
is an arbitrary hydrostatic pressure, the second term is associated with the isotropic part of the Cauchy stress and the third term is associated with the anisotropic part of the Cauchy stress. Interestingly, the recent theoretical model of Lopez-
Panencia
3, 4
agrees with that of Guo et al
1, 2
, although it is developed from a completely different perspective.
S3 – Theory of Shape Memory Behavior of Elastomers Reinforced by Glassy Fibers
Based on Guo’s model, we develop a thermomechanical constitutive model to describe the shape memory behavior of composites consisting of an elastomer matrix and glassy polymer fibers that pass through the glass transition during the temperature cycles.
During a shape memory cycle, the model decomposes the total deformation
F
into the thermal deformation F
T
and the mechanical deformation F
M
, that is, F
F F
M
. The thermal
3
deformation, F
T
, is directly described by a simple model based on the observation of experiments. The mechanical deformation, F
M
, gives rise to the stress acting on the composite system. At high temperatures, fibers are in a rubbery state, and
f
is
r
(this value is measured by experiments). Therefore, at time t
t
0
with a high temperature T
T
0
, the Cauchy stress is
0
p I
a f
0
F 0
M
T b f
0
1
I
4
3/ 2
F a
M 0
F a
M 0
. (S3)
During glass transition, for the sake of model simplicity we make several assumptions and: i) We phenomenologically assume that the fibers can be described as an aggregate of rubbery and glassy phases, and the phase transition between these two phases is realized through the change of volume fraction of each phase.
5, 6 ii) The volume fraction of each phase ( f r
for the rubbery phase and f g
for the glassy phase) as a function of temperature is defined as
6
: f r
1 exp
1
T
T r
/ A
, and f g
1 f r
, (S4) with a parameter
A
characterizing the width of the phase transition zone, and a reference temperature T r
. iii) During glass transition,
is simply described as f
f
f
r r
f
g g
(
is also measured g by experiments). As a result
f
varies from
r
to
g
, which leads to the change of
a and
b
in Eq. (S2), from
a f
r
(
b f
r
) to
a f
g
(
b f
g
). iv) We assume that the newly formed glassy phase is in a stress-free configuration and take this as its reference configuration for any subsequent deformation 7 .
Based on the assumption that the newly formed glassy phase is in a stress-free configuration, when we calculate the total Cauchy stress applied to the composite during glass
4
transition, the increasing amounts of
a
and
b
is only associated with the deformation after the formation of the glassy phase resulting in the corresponding increase of
a
and
b
.
Therefore, we obtain a general expression for the total Cauchy stress acting on the composite during glass transition, at time t
, and T
T
0
,
n
i n
1
I
a ,0
F n
M
M
T
F i
n
, M
F i
n
M
T
b ,0
1
1
I
4
I
4
F n
M
, a
0
3 2
i
n
F , a
M i
3 2
n
M
n
F a F a
0 M 0
F i
n
M a i
F i
n
M a i
. (S5)
In Eq. (S5),
=
f
0
,
=
f
-
f
t t
0
t
, F n
M
=
n
F i
M
F
0
M
, i
1
F i
n
M
=
n
F i
M
, a i
=
F i
1
M a
0
F i
1
M a
0
, and, I
4
=
. F
M
0
is the mechanical deformation before glass transition, and
F i
M
is the incremental deformation at time t
0 i t .
Using the theoretical model, we predict shape memory behavior for the matrix, fibers, and composites with different fiber orientations (Fig. S3a-i). Predictions are in good agreement with experiments.
5
FIGS. 3 .
Theoretical predictions and experiments for shape memory behavior of composites with different fiber orientations, as well as the matrix and fibers: (a) 0°; (b) 15°; (c) 30°; (d)
45°; (e) 60°; (f) 75°; (g) 90°; (h) matrix; (i) fibers.
S4 – Detailed Layout of the Printed Composites
Figure S4 shows the detailed layout of the sculpted surface of Fig. 4. An 80 mm × 80 mm × 1 mm thin sheet consists of a 28 mm × 80 mm region in the center made of pure matrix material and two 26 mm × 80 mm antisymmetric laminates at the two ends. The antisymmetric laminate consists of a 0.5 mm thick layer of pure matrix material and a 0.5 mm thick lamina with fibers along the loading direction (
= 0°), and a volume fraction that varies with position from v f
= 0.25 at the edge to v f
= 0.14 toward the center of the composite sheet.
FIGS. S4. Detailed layout of the sculpted surface.
Figure S5 shows the detailed layout of the self-folding and opening box of Fig. 5. Six stiff plastic plates with dimensions 40 mm × 20 mm × 1 mm or 20 mm × 20 mm × 1 mm are printed with active laminates serving as hinges to connect them. The laminate hinges with
6
dimensions 40 mm × 5 mm × 1 mm or 20 mm × 5 mm × 1 mm consist of a 0.5 mm thick layer of pure matrix material and a 0.5 mm thick lamina with fibers along the loading direction (
= 0°), and a volume fraction v f
= 0.25.
FIGS. S5. Detailed layout of the self-folding and opening box.
7
1
Z. Y. Guo, X. Q. Peng, and B. Moran, J. Mech. Phys. Solids., 54 , 1952 (2006).
2
Z. Y. Guo, X. Q. Peng, and B. Moran, Int. J. Solids Struct. 44 , 1949 (2007).
3
O. Lopez-Pamies, and M. I. Idiart, J. of Engrg. Math. 68 , 57 (2010).
4 O. Lopez-Pamies, M. I. Idiart, and Z. Y. Li, J. Eng. Mater.-T. ASME. 133 (2011).
5
Y. P. Liu, K. Gall, M. L. Dunn, A. R. Greenberg, and J. Diani, Int. J. Plast. 22 , 279 (2006).
6
H. J. Qi, T. D. Nguyen, F. Castro, C. M. Yakacki, and R. Shandas, J. Mech. Phys. Solids. 56 ,
1730 (2008).
7
K. N. Long, M. L. Dunn, and H. J. Qi, Int. J. Plast. 26 , 603 (2010).
8
