Type of Year or Contaminant (unit of Average Minimum Maximum
advertisement
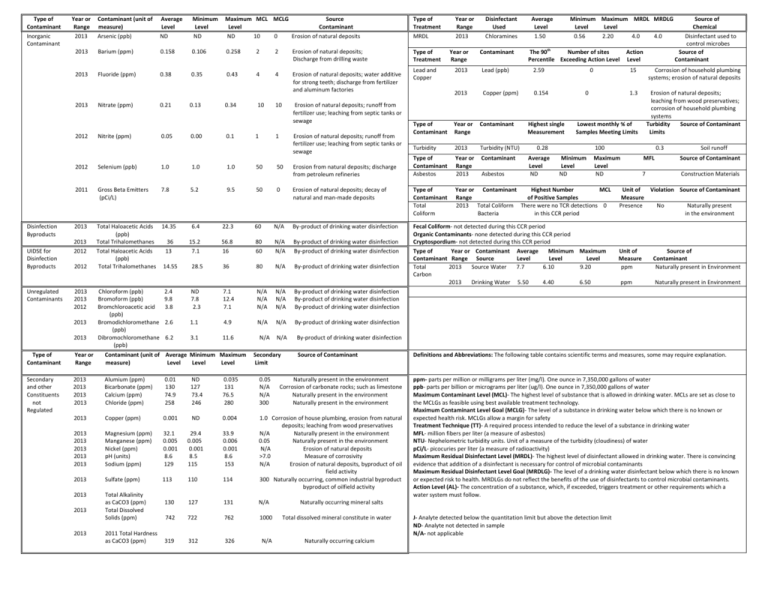
Type of Contaminant Inorganic Contaminant Year or Range 2013 Contaminant (unit of measure) Arsenic (ppb) Average Level ND Minimum Level ND Maximum MCL MCLG Source Level Contaminant ND 10 0 Erosion of natural deposits Type of Treatment MRDL 2013 Barium (ppm) 0.158 0.106 0.258 2 2 Erosion of natural deposits; Discharge from drilling waste Type of Treatment 2013 Fluoride (ppm) 0.38 0.35 0.43 4 4 Erosion of natural deposits; water additive for strong teeth; discharge from fertilizer and aluminum factories 2013 Nitrate (ppm) 0.21 0.13 0.34 10 10 Erosion of natural deposits; runoff from fertilizer use; leaching from septic tanks or sewage 2012 Nitrite (ppm) 0.05 0.00 0.1 1 Erosion of natural deposits; runoff from fertilizer use; leaching from septic tanks or sewage 2012 Disinfection Byproducts UIDSE for Disinfection Byproducts Unregulated Contaminants Selenium (ppb) 1.0 2011 Gross Beta Emitters (pCi/L) 2013 Total Haloacetic Acids 14.35 (ppb) Total Trihalomethanes 36 Total Haloacetic Acids 13 (ppb) Total Trihalomethanes 14.55 2013 2012 2012 2013 2013 2012 2013 2013 Chloroform (ppb) Bromoform (ppb) Bromchloroacetic acid (ppb) Bromodichloromethane (ppb) Dibromochloromethane (ppb) 7.8 1.0 1.0 1 50 50 Lead (ppb) 2.59 2013 Copper (ppm) 0.154 0 0 2013 Turbidity (NTU) Year or Range 2013 Contaminant Erosion of natural deposits; decay of natural and man-made deposits Type of Contaminant Total Coliform Year or Contaminant Highest Number MCL Range of Positive Samples 2013 Total Coliform There were no TCR detections 0 Bacteria in this CCR period Fecal Coliform- not detected during this CCR period Organic Contaminants- none detected during this CCR period Cryptospordium- not detected during this CCR period Type of Year or Contaminant Average Minimum Maximum Contaminant Range Source Level Level Level Total 2013 Source Water 7.7 6.10 9.20 Carbon 2013 Drinking Water 5.50 4.40 6.50 Erosion from natural deposits; discharge from petroleum refineries 0 6.4 22.3 60 N/A By-product of drinking water disinfection 15.2 7.1 56.8 16 80 60 N/A N/A By-product of drinking water disinfection By-product of drinking water disinfection 28.5 36 80 N/A By-product of drinking water disinfection 2.4 9.8 3.8 ND 7.8 2.3 7.1 12.4 7.1 N/A N/A N/A N/A N/A N/A By-product of drinking water disinfection By-product of drinking water disinfection By-product of drinking water disinfection 2.6 1.1 4.9 N/A N/A By-product of drinking water disinfection 6.2 3.1 11.6 Asbestos Highest single Measurement 15 Corrosion of household plumbing systems; erosion of natural deposits 1.3 Erosion of natural deposits; leaching from wood preservatives; corrosion of household plumbing systems Turbidity Source of Contaminant Limits Lowest monthly % of Samples Meeting Limits 0.28 Average Level ND Action Level 100 Minimum Level ND Source of Chemical Disinfectant used to control microbes Source of Contaminant 0.3 Maximum Level ND Soil runoff MFL Source of Contaminant 7 Construction Materials Unit of Violation Source of Contaminant Measure Presence No Naturally present in the environment Unit of Measure ppm ppm Source of Contaminant Naturally present in Environment Naturally present in Environment By-product of drinking water disinfection Contaminant (unit of Average Minimum Maximum measure) Level Level Level Secondary and other Constituents not Regulated 2013 2013 2013 2013 Alumium (ppm) Bicarbonate (ppm) Calcium (ppm) Chloride (ppm) 0.01 130 74.9 258 ND 127 73.4 246 0.035 131 76.5 280 0.05 N/A N/A 300 2013 Copper (ppm) 0.001 ND 0.004 2013 2013 2013 2013 2013 Magnesium (ppm) Manganese (ppm) Nickel (ppm) pH (units) Sodium (ppm) 32.1 0.005 0.001 8.6 129 29.4 0.005 0.001 8.5 115 33.9 0.006 0.001 8.6 153 2013 Sulfate (ppm) 113 110 114 1.0 Corrosion of house plumbing, erosion from natural deposits; leaching from wood preservatives N/A Naturally present in the environment 0.05 Naturally present in the environment N/A Erosion of natural deposits >7.0 Measure of corrosivity N/A Erosion of natural deposits, byproduct of oil field activity 300 Naturally occurring, common industrial byproduct byproduct of oilfield activity 2013 Total Alkalinity as CaCO3 (ppm) Total Dissolved Solids (ppm) 130 127 131 N/A 742 722 762 1000 319 312 326 N/A 2011 Total Hardness as CaCO3 (ppm) 2013 Type of Contaminant Asbestos Year or Range 2013 The 90th Number of sites Percentile Exceeding Action Level Turbidity Type of Contaminant 2013 Minimum Maximum MRDL MRDLG Level Level 0.56 2.20 4.0 4.0 Contaminant 50 Secondary Limit Contaminant Average Level 1.50 Year or Range 9.5 N/A Year or Range Disinfectant Used Chloramines Type of Contaminant 5.2 N/A Lead and Copper Year or Range 2013 Source of Contaminant Naturally present in the environment Corrosion of carbonate rocks; such as limestone Naturally present in the environment Naturally present in the environment Definitions and Abbreviations: The following table contains scientific terms and measures, some may require explanation. ppm- parts per million or milligrams per liter (mg/l). One ounce in 7,350,000 gallons of water ppb- parts per billion or micrograms per liter (ug/l). One ounce in 7,350,000 gallons of water Maximum Contaminant Level (MCL)- The highest level of substance that is allowed in drinking water. MCLs are set as close to the MCLGs as feasible using best available treatment technology. Maximum Contaminant Level Goal (MCLG)- The level of a substance in drinking water below which there is no known or expected health risk. MCLGs allow a margin for safety Treatment Technique (TT)- A required process intended to reduce the level of a substance in drinking water MFL- million fibers per liter (a measure of asbestos) NTU- Nephelometric turbidity units. Unit of a measure of the turbidity (cloudiness) of water pCi/L- picocuries per liter (a measure of radioactivity) Maximum Residual Disinfectant Level (MRDL)- The highest level of disinfectant allowed in drinking water. There is convincing evidence that addition of a disinfectant is necessary for control of microbial contaminants Maximum Residual Disinfectant Level Goal (MRDLG)- The level of a drinking water disinfectant below which there is no known or expected risk to health. MRDLGs do not reflect the benefits of the use of disinfectants to control microbial contaminants. Action Level (AL)- The concentration of a substance, which, if exceeded, triggers treatment or other requirements which a water system must follow. Naturally occurring mineral salts Total dissolved mineral constitute in water Naturally occurring calcium J- Analyte detected below the quantitation limit but above the detection limit ND- Analyte not detected in sample N/A- not applicable
