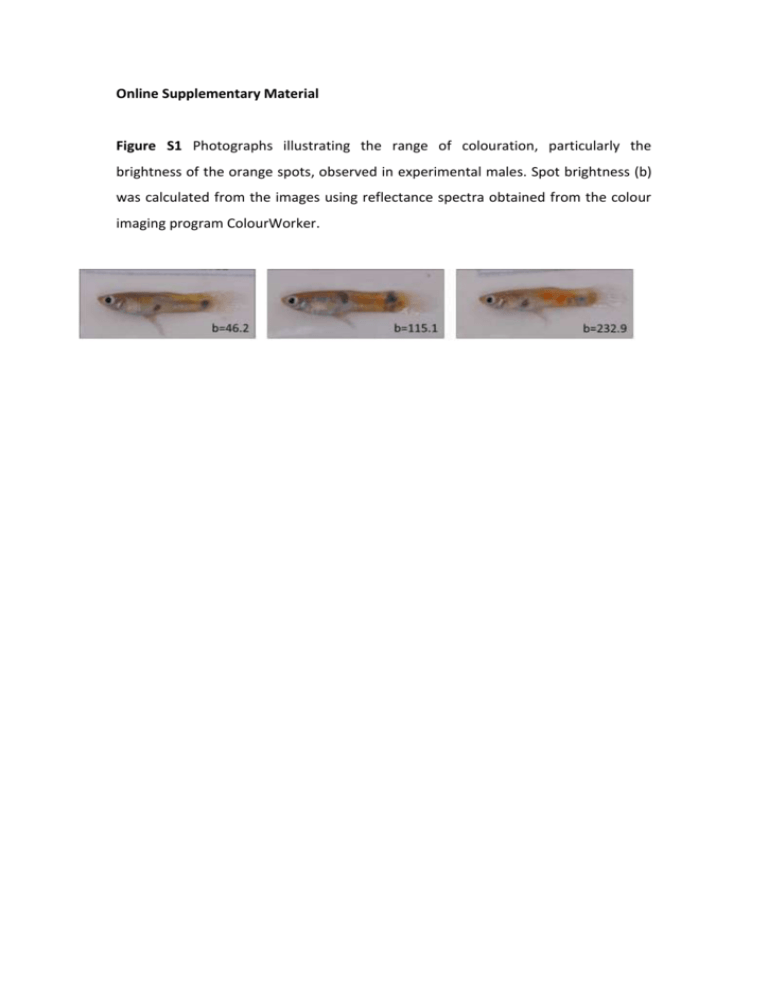
Online Supplementary Material Figure S1 Photographs illustrating
advertisement

Online Supplementary Material Figure S1 Photographs illustrating the range of colouration, particularly the brightness of the orange spots, observed in experimental males. Spot brightness (b) was calculated from the images using reflectance spectra obtained from the colour imaging program ColourWorker. Comparison of spectral data obtained using ColourWorker and a spectrometer. We evaluated the effectiveness of the colour-imaging program ColourWorker (available at: www.chrometrics.com) for measuring the brightness of the orange colour patches of male guppies when compared with spectral data obtained from a spectrometer. We performed both photography (followed by image analysis) and photospectrometry on the same set of custom-made, orange standards to compare the mean spectra obtained using each method. Methods The computer software ImageJ (http://imagej.nih.gov.ij) was used to generate an image comprising a set of six orange colour patches that primarily differed in brightness. This was achieved by splitting the image using the HSB (hue, saturation, brightness) function in ImageJ and manipulating the brightness of a replicated patch of orange colouration. The resulting images (.TIFF files) were then printed professionally on Kodak photographic paper. We used a Nikon D70 digital SLR camera fitted with a 105mm f/2.8D macro lens and mounted to a tripod to photograph the orange colour standard. Photography was performed in a Glanz™ diffusion tent (40cm x 40cm x 40cm) with lighting provided by two 500W portable Arlec™ halogen work lights placed on either side of the tent. We used an aperture of f/3.5 and shutter speed of 1/40s throughout and the white balance was set manually. We included a simulated Gretag-Macbeth colour chart (kindly provided by J. Anderson from Chrometrics) with each image, as required for subsequent analysis in the ColourWorker program. The colour standard has known reflectance properties and allows the program to compensate for any variation in scene illumination and/or the encoding characteristics of the camera (see www.chrometrics.com for more information). We used ColourWorker to obtain three measures of spectral reflectance for each of the six colour patches on the orange standard. The camera was calibrated using the simulated colour chart in each image and we selected our own custom files as the sample reference spectra. The program requires reference spectra that are specific to the materials that are analysed, because spectral variance among related materials tends to be lower than that obtained from unrelated objects (J. Anderson, pers. com. to JK). Thus we generated our own reference files using spectra from guppy carotenoid patches that we attained previously. After exporting the data from ColourWorker, we calculated mean reflectance for each of the six colour patches on the orange standard. Following the imaging, an Ocean Optics USB4000 (Ocean Optics Inc., USA) spectrometer fitted to a miniature deuterium UV-VIS tungsten light source (Analytical Instrument Systems, Inc, NJ, USA) was used to measure the spectral reflectance of the orange colour standard. Measurements were made using a 400 µm bifurcated reflection probe held at 90o and fixed height to the sample using a reflection probe holder. Each measurement was made relative to a light (using an unprinted sample of Kodak photographic paper) and dark standard. We obtained three reflectance measures for each colour patch over the wavelength range 400700nm. Spectral data were collated in Spectrasuite software (Ocean Optics) and integrated over 1nm intervals using the software program R. We calculated the mean reflectance of each of the six orange colour patches for comparison with the spectra obtained using ColourWorker. Results The spectra obtained from ColourWorker and the spectrometer are comparable, particularly over the 580-700nm wavelength range (figure S2a and S2b). There is more variation among the reflectances obtained by spectrometer, particularly for in the medium-wavelength range (480-540nm; figure S2b). Both methods were comparable in terms of evaluating consistent differences in total orange brightness (e.g. 600-640nm) among the six orange colour patches. The spectra attained using ColourWorker and a spectrometer can be comparable, depending on the wavelength range of interest. We noted that the selection of the reference spectra in the ColourWorker program has a big effect on the data attained, thus care must be taken to ensure the reference files are appropriate. In summary, the ColourWorker program is easy to use and does not require significant spectral processing (interpolation, smoothing etc.). However, users of the program should ideally have some prior knowledge of the spectral properties of the materials they are analysing, to ensure accuracy of the data attained. Figure S2 Spectral reflectance of six orange colour patches (varying in brightness from a (dullest) to f (brightest)) measured using the (a) program ColourWorker and (b) a USB 4000 Ocean Optics spectrometer. (a) 100 Percentage reflectance 80 a b c d e f 60 40 20 0 400 500 600 700 Wavelength (nm) (b) 100 a b c d e f Percentage reflectance 80 60 40 20 0 400 500 Wavelength (nm) 600 700


