Three Way Hierarchical Log Linear Analysis:
advertisement
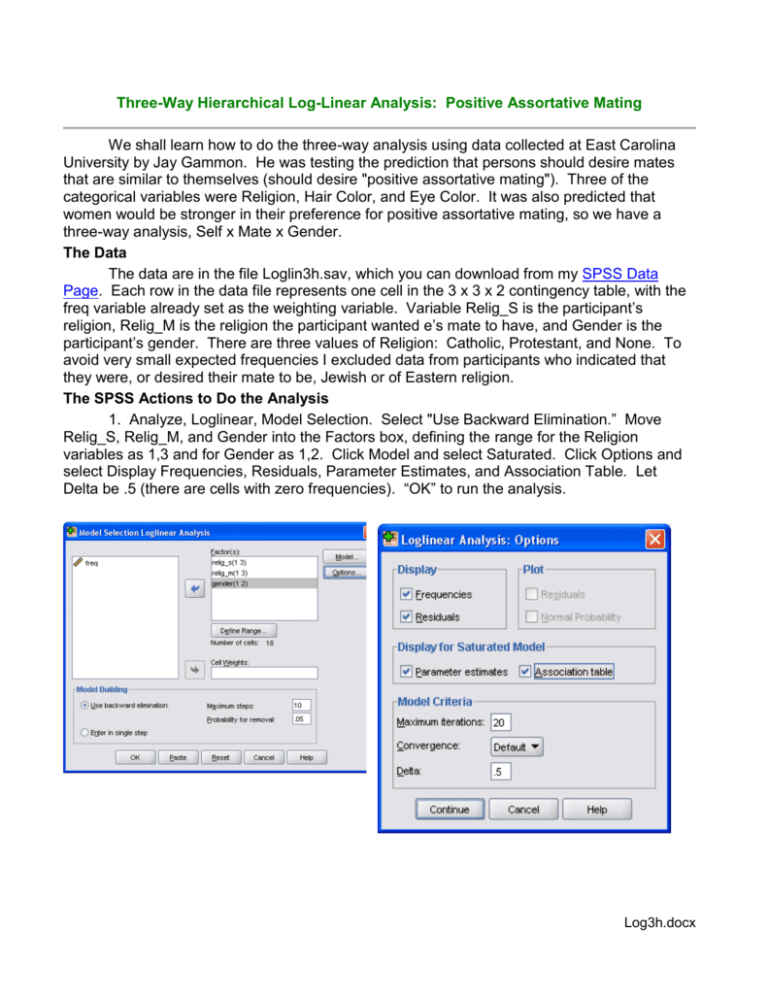
Three-Way Hierarchical Log-Linear Analysis: Positive Assortative Mating We shall learn how to do the three-way analysis using data collected at East Carolina University by Jay Gammon. He was testing the prediction that persons should desire mates that are similar to themselves (should desire "positive assortative mating"). Three of the categorical variables were Religion, Hair Color, and Eye Color. It was also predicted that women would be stronger in their preference for positive assortative mating, so we have a three-way analysis, Self x Mate x Gender. The Data The data are in the file Loglin3h.sav, which you can download from my SPSS Data Page. Each row in the data file represents one cell in the 3 x 3 x 2 contingency table, with the freq variable already set as the weighting variable. Variable Relig_S is the participant’s religion, Relig_M is the religion the participant wanted e’s mate to have, and Gender is the participant’s gender. There are three values of Religion: Catholic, Protestant, and None. To avoid very small expected frequencies I excluded data from participants who indicated that they were, or desired their mate to be, Jewish or of Eastern religion. The SPSS Actions to Do the Analysis 1. Analyze, Loglinear, Model Selection. Select "Use Backward Elimination.” Move Relig_S, Relig_M, and Gender into the Factors box, defining the range for the Religion variables as 1,3 and for Gender as 1,2. Click Model and select Saturated. Click Options and select Display Frequencies, Residuals, Parameter Estimates, and Association Table. Let Delta be .5 (there are cells with zero frequencies). “OK” to run the analysis. Log3h.docx 2 2. Analyze, Descriptive Statistics, Crosstabs. Move Relig_S into the Rows box and Relig_M into the Columns box. Click Statistics and select 2. Click Cells and select Observed, Expected, and Row Percentages. 3. Analyze, Descriptive Statistics, Crosstabs. Keep Relig_S into the Rows box, but replace Relig_M with Gender in the Columns box. In Statistics keep 2. In Cells keep Observed, but replace Row Percentages with Column Percentages. The Saturated Model The first model evaluated is the saturated model, which includes all effects and thus perfectly fits the data. The “Tests that K-Way ……” show us that we could delete the threeway interaction with little effect, but that dropping all of the two-way interactions would significantly reduce the goodness of fit between model and data. The “Tests of PARTIAL associations” (which are adjusted for all other effects in the model) indicate a significant association between respondents' own religion and that desired in their mates, as well as main effects of all variables. “Estimates for Parameters” shows high values for the four parameters (one per df) in the Relig_S x Relig_M effect. The parameter estimates for the main effects reflect the fact we did not have equal numbers of respondents in the Catholic, Protestant, and None groups and we had more female respondents than male respondents. Backward Elimination After evaluating the full model, HILOGLINEAR attempts to remove effects, starting with the highest-order effect. It removes it and tests whether the removal significantly (.05 default alpha) increased the 2 (made the fit worse). If removing that effect has no significant effect, then that effect remains out and HILOGLINEAR moves down to the next level (in our case, the 2-way effects). The effect at that level whose removal would least increase the 2 is removed, unless its removal would cause a significant increase of the 2. Then the next least important effect at that level is evaluated for removal, etc., etc., until all effects at a level are retained or all effects have been tested and removed. When an interaction effect is retained, lower-order effects for all combinations of the variables in the higher-order effect must also be retained. With luck (not always) this method will lead you to the same final model that the tests of partial associations would suggest. With our data, deleting the triple interaction does not significantly increase the goodness-of-fit 2, so the triple interaction is removed. The two-way effects are then evaluated. Deletion of Relig_S x Gender or Relig_M x Gender would not have a significant effect, so Relig_M x Gender (which produces the smaller change) is deleted. Note that with Relig_M x Gender out, Relig_S x Gender is now significant, so the backwards elimination stops. We are left with a model which contains Relig_S x Relig_M and Relig_S x Gender. Since a hierarchical analysis always retains lower-order effects contained within retained higher-order effects, our model also includes the main effects of Relig_S, Relig_M, and Gender. The model fits the data well -- the goodness-of-fit chi-square has a nice, high p of .954, and all of the residuals are small. Crosstabs was used to obtain unpartialled tests of the two-way associations that our hierarchical analysis indicated were significant. Crosstabs' tests totally ignore variables not included in the effect being tested. For the Relig_S x Relig_M analysis we obtain an enormous 2. 3 Positive Assortative Mating on the Main Diagonal Our research hypothesis was that individuals would prefer to mate with others similar to themselves (in this case, of the same religion). Look at the main diagonal (upper left cell, middle cell, lower right cell) of the Relig_S x Relig_M table. Most of the counts are in that diagonal, which represents individuals who want mates of the same religion as their own. If we sum the counts on the main diagonal, we see that 185 (or 92.5%) of our respondents said they want their mates to be of the same religion as their religion. How many respondents would we expect to be on this main diagonal if there was no correlation between Relig_S and Relig_M? The answer to that question is simple: Just sum the expected frequencies in that main diagonal -- in the absence of any correlation, we expect 108 (54%) of our respondents to be on that main diagonal. Now we can employ an exact binomial test of the null hypothesis that the proportion of respondents desiring mates with the same religion as their own is what would be expected given independence of self religion and ideal mate religion (binomial p = .54). The one-tailed p is the P(Y 185 | n = 200, p = .54). Back in PSYC 6430 you learned how to use SAS to get binomial probabilities. In the little program below, I obtained the P(Y 184 | n = 200, p = .54), subtracted that from 1 to get the P(Y 185 | n = 200, p = .54), and then doubled that to get the two-tailed significance level. The SAS output shows that p < .001. data p; LE184 = PROBBNML(.54, 200, 184); GE185 = 1 - LE184; p = 2*GE185; proc print; run; Obs LE184 GE185 p 1 1 0 0 You can also use SPSS to get an exact binomial probability. See my document Obtaining Significance Levels with SPSS. 4 The unpartialled 2 on Relig_S x Gender is also significant. The column percentages in the table make it fairly clear that this effect is due to men being much more likely than women to have no religion. SAS Catmod options pageno=min nodate formdlim='-'; data Religion; input Relig_Self Relig_Mate Sex count; cards; 1 1 1 20.5 1 1 2 7.5 1 2 1 0.5 1 2 2 0.5 1 3 1 1.5 1 3 2 1.5 2 1 1 1.5 2 1 2 1.5 2 2 1 86.5 2 2 2 49.5 2 3 1 3.5 2 3 2 2.5 3 1 1 0.5 3 1 2 1.5 3 2 1 2.5 3 2 2 3.5 3 3 1 8.5 3 3 2 15.5 proc catmod; weight count; model Relig_Self*Relig_Mate*Sex = _response_; Loglin Relig_Self|Relig_Mate|Sex; run; Submit this code to obtain the analysis of the saturated model in SAS. Karl L. Wuensch, Dept. of Psychology, East Carolina University, Greenville, NC 27858 USA March, 2012 5 Links Return to Wuensch’s Statistics Lessons Page Download the SPSS Output Log-Linear Contingency Table Analysis, Two-Way Three-Way Nonhierarchical Log-Linear Analysis: Escalators and Obesity Four Variable LOGIT Analysis: The 1989 Sexual Harassment Study
