Fig. 5. Representative XMT images of Coso 1
advertisement
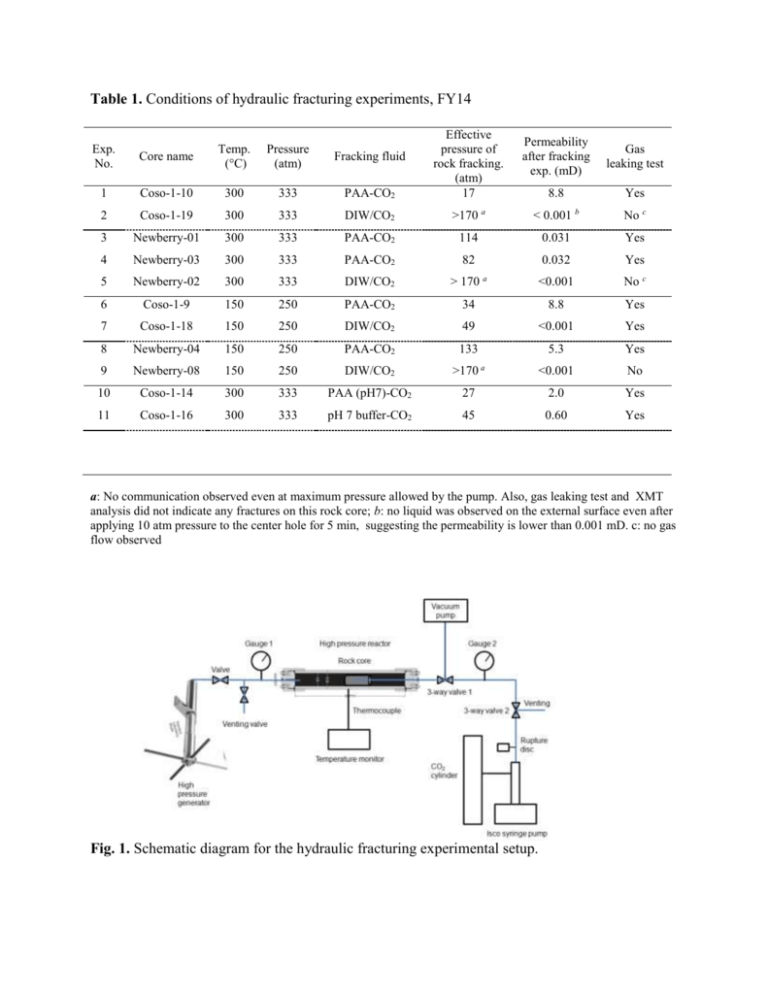
Table 1. Conditions of hydraulic fracturing experiments, FY14 Exp. No. 1 Core name Temp. (°C) Pressure (atm) Fracking fluid Coso-1-10 300 333 PAA-CO2 Effective pressure of rock fracking. (atm) 17 a Permeability after fracking exp. (mD) Gas leaking test 8.8 Yes < 0.001 b No c 2 Coso-1-19 300 333 DIW/CO2 >170 3 Newberry-01 300 333 PAA-CO2 114 0.031 Yes 4 Newberry-03 300 333 PAA-CO2 82 0.032 Yes 5 Newberry-02 300 333 DIW/CO2 > 170 a <0.001 No c 6 Coso-1-9 150 250 PAA-CO2 34 8.8 Yes 7 Coso-1-18 150 250 DIW/CO2 49 <0.001 Yes 8 Newberry-04 150 250 PAA-CO2 133 5.3 Yes <0.001 No a 9 Newberry-08 150 250 DIW/CO2 >170 10 Coso-1-14 300 333 PAA (pH7)-CO2 27 2.0 Yes 11 Coso-1-16 300 333 pH 7 buffer-CO2 45 0.60 Yes a: No communication observed even at maximum pressure allowed by the pump. Also, gas leaking test and XMT analysis did not indicate any fractures on this rock core; b: no liquid was observed on the external surface even after applying 10 atm pressure to the center hole for 5 min, suggesting the permeability is lower than 0.001 mD. c: no gas flow observed Fig. 1. Schematic diagram for the hydraulic fracturing experimental setup. a: Coso-1-10 before b: Coso-1-10 after Fig. 2. XMT images of Coso 1-10 before (left) and after (right) hydraulic fracturing experiment. Control experiment (#2, coso-1-19) did not show the presence of fractures even at differential pressures as high as 170 atm. The fractures extended ~0.5 mm above and ~17 mm below this transversal section. a: Coso-1-9 before b: Coso-1-9 after Fig. 3. XMT images of rock cores Coso 1-9 before (left) and after (right) hydraulic fracturing experiment. Control experiment (#8, Coso 1-18) did not show the presence of fractures. The fractures extend ~10 mm above and ~5 mm below this transversal section. a: Newberry-04 before b: Newberry-04 after Fig. 4. XMT images of Newberry-04 rock core fractured with PAA-CO2 fracturing fluid. The Figure shows sample micrographs before (left) and after (right) hydraulic fracturing experiment. The fractures extend ~0.4 mm above and ~1.5 mm below this transversal section. Control experiment (Newberry-08) did not show the presence of fractures. a: Coso-1-14 before b: Coso-1-14 after c: Coso-1-16 before d: Coso-1-16 after Fig. 5. Representative XMT images of Coso 1-14 (a, b) and Coso 1-16 (c, d) rock cores before and after hydraulic fracturing experiment. The arrows point to the fractures. Note the much larger aperture of the fractures created on Coso 1-14. Fig. 6. CFD model of Coso 1-10 showing: left: isosurface of fractures 1 and 2 for Coso 1-10 with XMT data (left). The inlet was extruded during volume meshing to improve solution convergence. Middle: CFD model of Coso 1-10 showing velocity vectors colored by absolute velocity. The flow rate and velocity of the flow in fracture 1 is higher than fracture 2 due to smaller cross-sectional area but higher fracture volume. Right: contours of static pressure showing gradient along the fracture wall. Fig. 7. CFD model of Newberry-04 showing: Left: a slice of XMT data with isosurface generated using segmented data for Newberry 4 sample. The interface between the rock and the rock core cradle was assumed as the outlet for the CFD model. Middle: CFD model of Newberry-04 showing velocity vectors colored by absolute velocity. Volumetric flow and fluid velocity in both fracture 1 and 2 are similar since the volumes and apertures of fractures 1 and 2 are comparable. Right: contours of static pressure.
