Report
advertisement

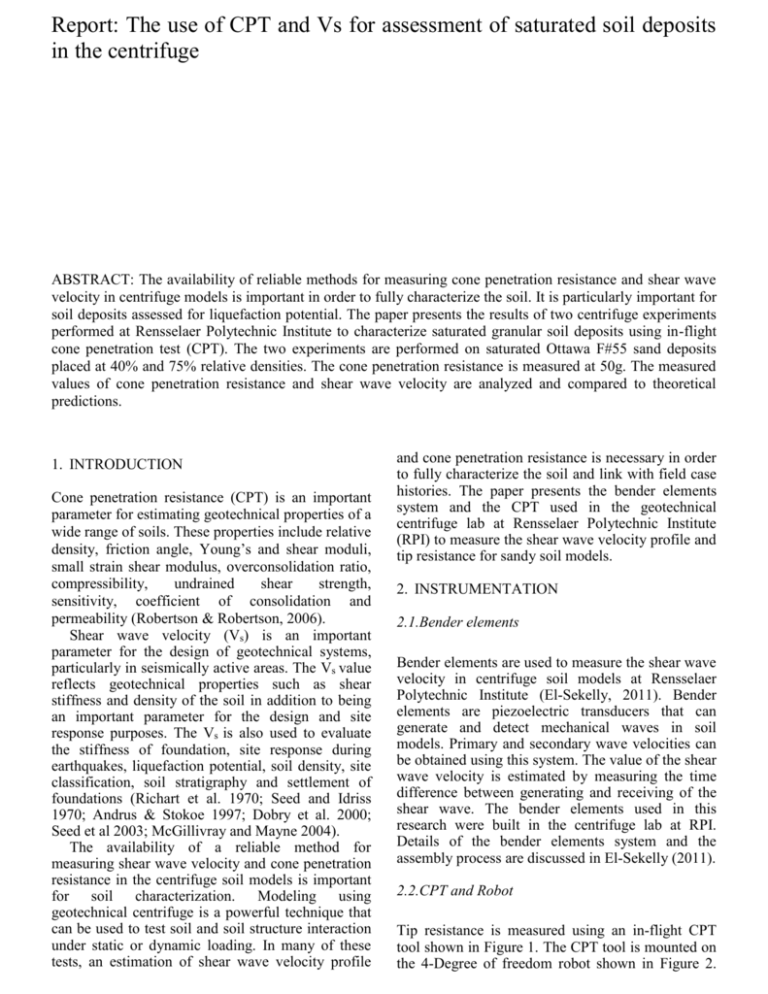
Report: The use of CPT and Vs for assessment of saturated soil deposits in the centrifuge ABSTRACT: The availability of reliable methods for measuring cone penetration resistance and shear wave velocity in centrifuge models is important in order to fully characterize the soil. It is particularly important for soil deposits assessed for liquefaction potential. The paper presents the results of two centrifuge experiments performed at Rensselaer Polytechnic Institute to characterize saturated granular soil deposits using in-flight cone penetration test (CPT). The two experiments are performed on saturated Ottawa F#55 sand deposits placed at 40% and 75% relative densities. The cone penetration resistance is measured at 50g. The measured values of cone penetration resistance and shear wave velocity are analyzed and compared to theoretical predictions. 1. INTRODUCTION Cone penetration resistance (CPT) is an important parameter for estimating geotechnical properties of a wide range of soils. These properties include relative density, friction angle, Young’s and shear moduli, small strain shear modulus, overconsolidation ratio, compressibility, undrained shear strength, sensitivity, coefficient of consolidation and permeability (Robertson & Robertson, 2006). Shear wave velocity (Vs) is an important parameter for the design of geotechnical systems, particularly in seismically active areas. The Vs value reflects geotechnical properties such as shear stiffness and density of the soil in addition to being an important parameter for the design and site response purposes. The Vs is also used to evaluate the stiffness of foundation, site response during earthquakes, liquefaction potential, soil density, site classification, soil stratigraphy and settlement of foundations (Richart et al. 1970; Seed and Idriss 1970; Andrus & Stokoe 1997; Dobry et al. 2000; Seed et al 2003; McGillivray and Mayne 2004). The availability of a reliable method for measuring shear wave velocity and cone penetration resistance in the centrifuge soil models is important for soil characterization. Modeling using geotechnical centrifuge is a powerful technique that can be used to test soil and soil structure interaction under static or dynamic loading. In many of these tests, an estimation of shear wave velocity profile and cone penetration resistance is necessary in order to fully characterize the soil and link with field case histories. The paper presents the bender elements system and the CPT used in the geotechnical centrifuge lab at Rensselaer Polytechnic Institute (RPI) to measure the shear wave velocity profile and tip resistance for sandy soil models. 2. INSTRUMENTATION 2.1.Bender elements Bender elements are used to measure the shear wave velocity in centrifuge soil models at Rensselaer Polytechnic Institute (El-Sekelly, 2011). Bender elements are piezoelectric transducers that can generate and detect mechanical waves in soil models. Primary and secondary wave velocities can be obtained using this system. The value of the shear wave velocity is estimated by measuring the time difference between generating and receiving of the shear wave. The bender elements used in this research were built in the centrifuge lab at RPI. Details of the bender elements system and the assembly process are discussed in El-Sekelly (2011). 2.2.CPT and Robot Tip resistance is measured using an in-flight CPT tool shown in Figure 1. The CPT tool is mounted on the 4-Degree of freedom robot shown in Figure 2. The in-flight robot is designed to perform multiple tasks while the centrifuge is spinning. The robot is capable of articulating in three linear dimensions and rotating around one axis. The CPT tool used in this research is 12mm in diameter and 150mm in length. X & Y path for the robot Load Cell Location of the CPT tool Figure 2. (Nees@RPI) The 4-Degree of freedom robot friction. The main purpose of using the 2D laminar container in this research is to have comparable boundary condition during the dynamic experiments used in the soil liquefaction assessment. 3. EXPERIMENTAL PROCEDURES Connection with robot Figure 1. The In-flight CPT tool (Nees@RPI) 2.3.laminar container(2D) The experiments were conducted in the 2D laminar container shown in Figure 3. The 2D laminar container is designed specifically for use with RPI’s 2D shaker and is constructed from 45 twelve-sided lightweight aluminum alloy rings arranged in a stack. Each ring is 8.9 mm (0.35 inches) in height with a 594 mm (23.4 inches) mean inside diameter, and each ring is separated from each other by 60 roller bearings, specially designed to allow motion in the two horizontal directions with minimal The data presented in this paper corresponds to two centrifuge experiments conducted in the 2D laminar container. The height of the soil model in the two experiments was 24 cm representing a prototype depth of 12 m at 50g. The scaling factors for different test properties were adopted from Whitman & Arulanandan (1985). Experiments TW1 and TW2 were conducted on saturated Ottawa F#55 sand deposits placed at relative densities of 40% and 75%, representing relatively loose and dense sand deposits respectively. Ottawa F#55 sand is a clean uniform fine sand with a specific gravity of 2.665, grain size distribution characterized by D10=0.161 mm, D50=0.25 mm, and a uniformity coefficient of 1.522. The minimum and maximum void ratios are emin=0.58 and emax=0.77. The fine content of Ottawa F#55 sand is less than 0.1%. Properties of the soil used in experiments TW1 and TW2 are presented in Table 1. Centrifuge basket In-flight robot Figure 3. 2-D laminar container (dimensions in cm) The method used for building the model is the dry pluviation method, where the sand is placed in layers, typically 0.5 inch thick, using a pluviator. The container is then placed on the centrifuge platform as shown in Figure 4. The saturation was then performed by de-airing the model and then percolation of de-aired water at a very slow rate to insure full saturation of the model. Table 1. Soil properties for Tests TW1 & TW2 Condition (Dry/Satu.) γ (sat.) (KN/m³) Dr % TW1 TW2 Satu. 19.2 50 Satu. 19.8 80 The CPT was conducted at 50g. The CPT tool was pushed into the soil model, using RPI robot, at a rate of 0.5mm/sec to a depth of 120mm representing 6m of sand deposit in the prototype scale. Corte et al. (1991) revealed that there is no noticeable effect of the rate of penetration on the tip resistance in the range from 0.5 to 10 mm/sec. The rate of 0.5 mm/sec used in this research was chosen to avoid any contribution of pore pressure build-up due to progression of the cone into the soil. 2D laminar container Figure 4. The centrifuge basket with the robot and the 2-D laminar container in place 4. RESULTS AND ANALYSIS The profiles of tip resistance versus vertical effective stress for both experiments are shown in Figures 5&6. For purpose of comparison, the tip resistance is normalized to its value at 1atm (101.33 kPa). The normalization of tip resistance is performed according to the method presented by Boulanger (2003), in which the author used the following formulas (Eqs. 1-3) to calculate the normalized tip resistance, 𝑞𝐶1𝑁 . 𝑃𝑎 𝐶𝑁 = ( 𝜎′𝑣𝑜 𝑚 ) (1) m=0.784 - 0.521. 𝐷𝑟 𝑞 𝑞𝐶1𝑁 = 𝐶𝑁 (𝑃𝐶 ) 𝑎 (2) (3) where 𝜎′𝑣𝑜 =vertical effective stress; 𝑃𝑎 =atmospheric pressure (101.33 kPa); 𝐶𝑁 =Normalization factor for tip resistance; 𝐷𝑟 =relative density of sand; 𝑞𝐶1𝑁 =normalized tip resistance; 𝑞𝐶 =tip resistance at 𝜎′𝑣𝑜 ; and m =overburden normalization exponent 0 0 Dr=40% 20 30 40 50 60 20 30 40 50 0 2 4 6 Dr=75% 10 Vertical Effevtive Stress [Kpa] 10 Vertical Effevtive Stress [Kpa] Vertical Effevtive Stress [Kpa] 10 0 Dr=40% 20 30 40 50 60 8 0 102 124 146 168 1810 2012 14 16 60 18 0 Tip resistance Q [MPa] Tip resistance Q [MPa] Dr=75% 10 Vertical Effevtive Stress [Kpa] 0 20 30 40 50 20 2 4 6 60 8 0 102 124 146 168 1810 20 12 14 16 18 20 Tip resistance Q [MPa] Tip resistance Q [MPa] Figure 5. The profile of tip resistance versus vertical effective stress for TW1 Figure 6. The profile of tip resistance versus vertical effective stress for TW2 The maximum measured tip resistance was used in the process of normalization. The reason for using the maximum measured tip resistance is that the normalized tip resistance becomes stable after a penetration depth of about 8-10D (critical depth), as indicated by the results presented by Bolton & Gui (1993), where D is the cone diameter. This happens to be the maximum depth the cone was able to reach in the experiment. Further penetration might have caused the water above the soil surface to seep into the wires of the load cell damaging the tool (Figure 1). A new and longer CPT tool is currently being developed in the lab to overcome the limitation of the CPT tool used in this research. The new tool has a smaller diameter and can penetrate much deeper into the soil model. Table 2 summarizes all the corrections and final normalized values of tip resistance and shear wave velocity. The shear wave velocity values presented in the paper are adopted from El-Sekelly (2011.). ElSekelly (2011) measured the shear wave velocities in centrifuge models for Ottawa F#55 sand deposits placed at relative densities of 40% and 75% using bender elements. During the conducted centrifuge tests, predefined mechanical shear waves were sent from the sender bender elements to the receiver bender elements placed at several depths. In all cases, the sender bender elements were excited with one cycle of sine wave having a frequency of 7000 Hz. The wave propagates in the soil and is recorded by the receiver bender elements. The sent wave and the typical output of the received waves are presented in El-Sekelly (2011). The first arrival time of the received wave is identified and the wave velocity was then calculated using the relation: 𝑑 Table 2: Normalization parameters for TW1 & TW2 m 𝐶𝑁 𝜎′𝑣𝑜 (kPa) 𝑞𝐶 (MPa) 𝑞𝐶1𝑁 𝑉𝑠1 (𝑚/𝑠) TW1 TW2 0.58 1.44 53.9 5.35 76.81 174 0.39 1.26 55.9 15.2 91.5 194 V= 𝑡 (4) where, V=velocity of the shear waves, d= distance between sender and receiver, t= time between sending and receiving the body waves For the purpose of comparison, the shear wave velocities are normalized to their values at 1atm (101.33 kPa). The normalization of shear wave velocity is performed using equation (5) (Stokoe et al., 1985). 𝑃 𝑉𝑠1 = 𝑉𝑠 (𝜎′𝑎 ) 0.25 (5) 𝑣𝑜 where 𝑉𝑠1 =Normalized shear wave velocity; 𝑉𝑠 =shear wave velocity at 𝜎′𝑣𝑜 ; 𝜎′𝑣𝑜 =vertical effective stress; 𝑃𝑎 =atmospheric pressure (101.33 kPa); A comparison between the actual and the predicted values of 𝑞𝐶1𝑁 and 𝑉𝑠1 is presented in Figure 8. Figure 8 indicates that results from this research tend to fit the formula proposed by Dobry (2010) more than the one proposed by Andrus et al. (2004). The sand used in this work is clean Ottawa F#55 sand with less than 0.1% fines. This is thought to be the reason why the equation developed by Dobry (2010) fits better the measured values in this research. 210 220 205 215 Normalized Shear wave velocity, Vs1 [m/s] Normalized Shear wave velocity, Vs1 [m/s] Figure 7 shows the change in normalized shear wave velocity with the change in relative density. The line is the least square linear regression of the data. Hardin and Richard (1963) concluded that the relation between shear wave velocity and void ratio, and thus relative density, is a linear relation. where 𝑉𝑠1 =Normalized shear wave velocity; and 𝑞𝐶1𝑁 =normalized tip resistance 200 195 190 185 180 175 170 165 160 155 150 35 This work Andrus et al. (2004) Dobry (2010) 210 205 200 195 190 185 180 175 170 165 160 155 40 45 50 55 60 65 70 75 80 Relative Density, Dr (%) Several researchers have studied the relation between the tip resistance and the shear wave velocity and developed empirical formulas relating the two parameters (Andrus et al. 2004; and Dobry 2010). Andrus et al. (2004) developed his formula using the results of Holocone sand sites with fine content, FC≤20%. Dobry (2010) used results from the same Holocone sand sites but considering only the sites that involve clean sand with fine content, FC≤5%. The formulas developed by Andrus et al. (2004) and Dobry (2010) are as follows: Andrus et al. (2004): (6) Dobry (2010): 𝑉𝑠1 (𝑚/𝑠) = 51.1(𝑞𝐶1𝑁 )0.272 70 90 110 130 150 170 190 Normalized Tip resistance, q Figure 7. The relation between normalized shear wave velocity and relative density 𝑉𝑠1 (𝑚/𝑠) = 62.6(𝑞𝐶1𝑁 )0.231 150 50 (7) 210 230 250 c1N Figure 8. Comparison between measured and predicted 𝑞𝐶1𝑁 and 𝑉𝑠1 5. DISCUSSION AND CONCLUSION Two centrifuge experiments were conducted at Rensselaer Polytechnic Institute on Ottawa F#55 sand deposits placed at relative densities of 40% and 75%. In the two experiments, the tip resistance was measured for the soil model at 50g. The shear wave velocities are adopted from El-Sekelly (2011). The results indicate a difference of about 150% in the normalized tip resistance between the two relative densities. The difference in the normalized shear wave velocity is much less (about 10%). The results suggest that the tip resistance is much more sensitive than the shear wave velocity to the change in relative density and thus, the liquefaction resistance of saturated sand deposits. Also, the results compare very well with the equation developed by Dobry (2010). REFERENCES Andrus, R. D., and Stokoe, K. H. 1997. “Liquefaction Resistance Based on Shear Wave Velocity.” Proceedings of Workshop on Evaluation of Liquefaction Resistance, NCEER-97-0022, Multidisciplinary Center for Earthquake Engineering Research, Buffalo, NY, 89-128. Andrus, R. D., Piratheepan, P., Ellis, B. S., Hsein, J. C., and Jianfeng, X. 2004. “Comparing Liquefaction Evaluation Methods Using Penetration - Vs Relationships.” Soil Dynamics and Earthquake Engineering, Vol. 24, 713–721. Bolton, M. D., and Gui, M. W., 1993. “The Study of Relative Density and Boundary Effects for Cone Penetration Tests in Centrifuge” Technical Report CUED/D-SOILS/TR256 Boulanger, R.W., 2003 "High overburden stress effects in liquefaction analyses." J. Geotechnical and Geoenvironmental Engineering, ASCE, 129(12), 1071-1082. Corte, J.F., Garnier, J., Cottineau, L.M., and Rault, G., 1991, “Determination of Model Soil Properties in the Centrifuge” Proceedings of International Conference Centrifuge 1991, Boulder CO, 13-14 June, pp. 607-614. Dobry, R., Borcherdt, R., Crouse, C.B., Idriss, I.M., Joyner, W.B., Martin, G.R., Power, M.S., Rinne, E.E., and Seed, R.B., 2000. “New Site Coefficients and Site Classifications System Used in Recent Building Seismic Code Provisions.” Earthquake Spectra 16 (1): 41–67. Dobry, R. 2010. “Comparison Between Clean Sand Liquifaction Charts Based on Penetration Resistance and Shear Wave Velocity.” Proceedings of the 5th International Conference on Recent Advances in Geotechnical Earthquake Engineering and Soil Dynamics. San Diego. El-Sekelly, W. 2011. “Soil Characterization in Centrifuge Models Through Measurement of S- and P-wave Velocities Using an Enhanced Bender Elements System”. Rensselaer Polytechnic Institute. (Master’s Thesis) El-Sekelly, W., Abdoun, T., Dobry, R. 2012. “Soil Characterization in Centrifuge Models Through Measurement of Shear Wave Velocities Using Bender Elements.” Proceedings of GeoCongress 2012: State of the Art and Practice in Geotechnical Engineering, Oakland, Ca, 2037–2047. El-Sekelly, W., Mercado, V., Abdoun, T., Zeghal, M., ElGanainy, H., 2013, “System Identification and bender elements for estimation of Vs”, International Journal of Physical Modeling in Geotechnics (Under review) Hardin, B.O. & Richart, F.E.J., 1963. Elastic wave velocities in Granular soils. Journal of Soil Mechanics and Foundations Divisions, Proceedings of the American Society of Civil Engineers, 89(Feb), pp.pp. 33–65. Idriss, I M, and Boulanger, R.W. 2004. “Semi-empirical procedure for evaluating liquefaction potential during earthquakes.” Proceding of the 3rd International Conference on Earthquake Geotechnical Engineering (ICEGE), 32–56. McGillivray, A., and Mayne, P. W. 2004. “Seismic Piezocone and Seismic Flat Dilatometer Tests at Treporti.” In Geotechnical and Geophysical Site Characterization, ISC-2, Porto, Portugal, Millpress, Rotterdam, 1623–1628. Nees@RPI http://nees.rpi.edu/ Date last accessed 03/19/2013. Richart, F. E., Hall, J. R. and Woods, R. D.. 1970. “Vibrations of Soils and Foundations”. PrenticeHall, Englewood Cliffs, N.J. Robertson, P.K, Robertson, K.L. 2006. “Guide to Cone Penetration Testing and its Application to Geotechnical Engineering”. Gregg Drilling & Testing, Inc. Seed, R. B., Cetin, K. O., Moss, R. E. S., Kammerer, A. M., Wu, J., Pestana, J. M., Riemer, M. F. et al. 2003. “Recent Advances in Soil Liquefaction Engineering: A Unified and Consistent Framework.” In 26th Annual ASCE Los Angeles Geotechnical Spring Seminar, Long Beach, CA, ASCE, Reston, VA, 71. Stokoe II, K. H., Lee, S. H. and Knox, D. P. 1985. “Shear Moduli Measurements Under True Triaxial Stresses.” Advances in the Art of Testing Soils Under Cyclic Conditions, V. Khosla (ed.), American Society of Civil Engineers, New York, NY: 166–185. Whitman, R.V., and Arulanandan K. 1985. “Centrifuge Model Testing with Dynamic and Cyclic Loading.” In ASCE Spec. Conf. on Advances in Soils Testing, 255–285.


