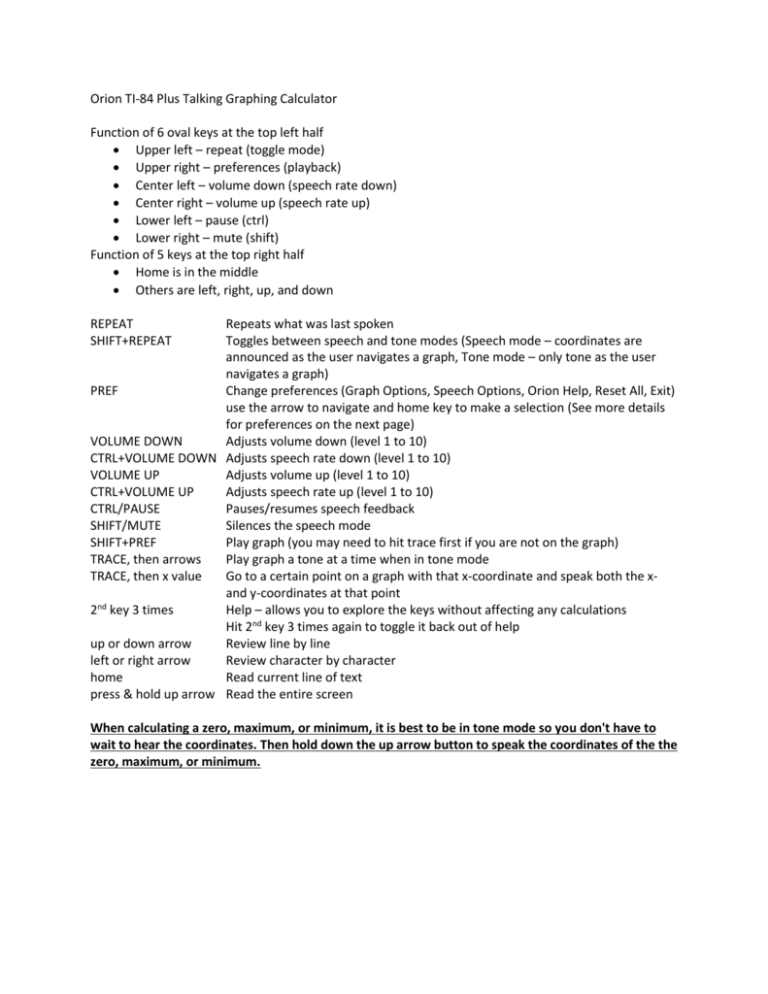
Orion and TI-84 keystrokes quick reference handout
advertisement

Orion TI-84 Plus Talking Graphing Calculator Function of 6 oval keys at the top left half Upper left – repeat (toggle mode) Upper right – preferences (playback) Center left – volume down (speech rate down) Center right – volume up (speech rate up) Lower left – pause (ctrl) Lower right – mute (shift) Function of 5 keys at the top right half Home is in the middle Others are left, right, up, and down REPEAT SHIFT+REPEAT Repeats what was last spoken Toggles between speech and tone modes (Speech mode – coordinates are announced as the user navigates a graph, Tone mode – only tone as the user navigates a graph) PREF Change preferences (Graph Options, Speech Options, Orion Help, Reset All, Exit) use the arrow to navigate and home key to make a selection (See more details for preferences on the next page) VOLUME DOWN Adjusts volume down (level 1 to 10) CTRL+VOLUME DOWN Adjusts speech rate down (level 1 to 10) VOLUME UP Adjusts volume up (level 1 to 10) CTRL+VOLUME UP Adjusts speech rate up (level 1 to 10) CTRL/PAUSE Pauses/resumes speech feedback SHIFT/MUTE Silences the speech mode SHIFT+PREF Play graph (you may need to hit trace first if you are not on the graph) TRACE, then arrows Play graph a tone at a time when in tone mode TRACE, then x value Go to a certain point on a graph with that x-coordinate and speak both the xand y-coordinates at that point 2nd key 3 times Help – allows you to explore the keys without affecting any calculations Hit 2nd key 3 times again to toggle it back out of help up or down arrow Review line by line left or right arrow Review character by character home Read current line of text press & hold up arrow Read the entire screen When calculating a zero, maximum, or minimum, it is best to be in tone mode so you don't have to wait to hear the coordinates. Then hold down the up arrow button to speak the coordinates of the the zero, maximum, or minimum. Preferences Use the arrow keys to navigate and the home key to select. Graph Options o Navigation tone length - This option sets the length of an individual tone for hearing a whole graph or reviewing a graph step-by-step. o Equation playback duration - This option sets the speed of the duration of playback of a whole graph. The smaller the number, the faster the playback. o Negative value noise - This option enables or disables the static noise and adjusts the tone level while in the negative Y region of a graph. o Negative value vibration - This option enables or disables the haptic feedback while in the negative Y region of a graph. o Coordinate announcements - This option sets in what order the X and Y coordinates are announced and if both should be announced. o Reset Graph Settings - This option resets all graph settings to the factory defaults. Speech Options o Voice - This option presents a list of voices to change how the Orion sounds. o Pitch - This option presents a list of values to adjust the pitch of a selected voice. o Reset Speech Settings - Selecting this option returns the speech settings to the default factory settings. Orion Help o About Orion - This option informs you which version of Orion software is running Reset All Exit TI-84 Keys Graphing and Table Keys The 5 keys left to right under the screen followed by what is above it in parentheses (the ones in parentheses are accessed by pressing 2nd first): y= (stat plot), window (table setup), zoom (format), trace (calculate), graph (table) y= is used to enter the equation (stat plot) is used to turn scatter plots on or off window is used to enter the beginning and ending x and y values for the screen (table setup) is used to set the starting value of the table and what to count by zoom is used to zoom in and out (zoom 6 is the standard window going from -10 to 10 for both x and y) (format) is used to change formatting and is rarely used trace is used to put the cursor on the graph of the equation (must be used before playing the graph) (calculate) is used to find y-coordinates, x-intercepts or zeros, minimums, maximums, and intersections graph is used to display the graph on the screen (table) is used to display the table of values for a graph Other keys by row below the graphing and table keys 2nd, mode, delete Alpha, x, stat Math, apps, program, vars, clear x to the -1 power, sin, cos, tan, power squared, comma, left parentheses, right parentheses, division log, 7, 8, 9, multiplication ln, 4, 5, 6, subtraction store, 1, 2, 3, addition on, 0, decimal, negative, enter Anything in blue written above the keys is accessed using the blue 2nd key first and then that key. Anything in green written above the key is accessed using the green alpha key first and then that key. Additional keys commonly used in Algebra Quit (2nd mode) is used to go back to the home screen Convert decimals to fractions (matah) Cube root and other root (math, go down the list using down arrow) Absolute Value (math, right arrow) Matrices (2nd, x to the -1 power) Pi (2nd, power) Square root (2nd, squared) e (2nd, division) Answer (2nd, negative) is used to use the last answer in the home screen


