Appendix To aid in establishing the parameter values in the model
advertisement
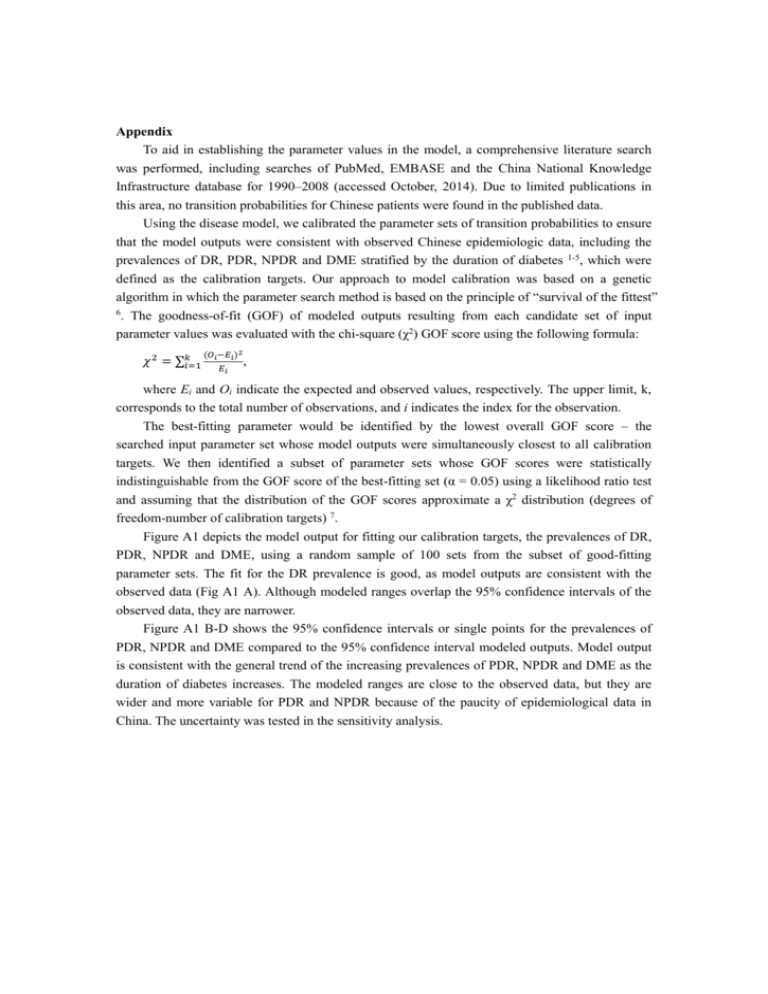
Appendix To aid in establishing the parameter values in the model, a comprehensive literature search was performed, including searches of PubMed, EMBASE and the China National Knowledge Infrastructure database for 1990–2008 (accessed October, 2014). Due to limited publications in this area, no transition probabilities for Chinese patients were found in the published data. Using the disease model, we calibrated the parameter sets of transition probabilities to ensure that the model outputs were consistent with observed Chinese epidemiologic data, including the prevalences of DR, PDR, NPDR and DME stratified by the duration of diabetes 1-5, which were defined as the calibration targets. Our approach to model calibration was based on a genetic algorithm in which the parameter search method is based on the principle of “survival of the fittest” 6 . The goodness-of-fit (GOF) of modeled outputs resulting from each candidate set of input parameter values was evaluated with the chi-square (χ2) GOF score using the following formula: 𝜒 2 = ∑𝑘𝑖=1 (𝑂𝑖 −𝐸𝑖 )2 𝐸𝑖 , where Ei and Oi indicate the expected and observed values, respectively. The upper limit, k, corresponds to the total number of observations, and i indicates the index for the observation. The best-fitting parameter would be identified by the lowest overall GOF score – the searched input parameter set whose model outputs were simultaneously closest to all calibration targets. We then identified a subset of parameter sets whose GOF scores were statistically indistinguishable from the GOF score of the best-fitting set (α = 0.05) using a likelihood ratio test and assuming that the distribution of the GOF scores approximate a χ2 distribution (degrees of freedom-number of calibration targets) 7. Figure A1 depicts the model output for fitting our calibration targets, the prevalences of DR, PDR, NPDR and DME, using a random sample of 100 sets from the subset of good-fitting parameter sets. The fit for the DR prevalence is good, as model outputs are consistent with the observed data (Fig A1 A). Although modeled ranges overlap the 95% confidence intervals of the observed data, they are narrower. Figure A1 B-D shows the 95% confidence intervals or single points for the prevalences of PDR, NPDR and DME compared to the 95% confidence interval modeled outputs. Model output is consistent with the general trend of the increasing prevalences of PDR, NPDR and DME as the duration of diabetes increases. The modeled ranges are close to the observed data, but they are wider and more variable for PDR and NPDR because of the paucity of epidemiological data in China. The uncertainty was tested in the sensitivity analysis. A. B. 0.7 0.16 0.14 0.6 Prevalence of PDR Prevalence of DR 0.12 0.5 0.4 0.3 0.10 0.08 0.06 0.04 0.02 0.2 0.00 −0.02 0.1 1-4 years 5-10 years 11-15 years >15 years >10 years Diabetes duration =8 years D. 0.45 0.30 0.40 0.25 Prevalence of DME Prevalence of NPDR C. 1-4 years 5-10 years 11-15 years >15 years Diabetes duration 0.35 0.30 0.25 0.20 0.20 0.15 0.10 0.05 0.15 0.00 1-4 years 5-10 years >10 years Diabetes duration =12 years 1-4 years 5-10 years <10 years Diabetes duration >10 years Observed values Predicted values Figure A1. Observed and mean model-projected prevalence of DR (A), PDR (B), NPDR (C) and ME (D) in Chinese diabetic patients stratified by disease duration. We superimposed 95%CIs reflecting uncertainty. DR, diabetic retinopathy; NPDR, nonproliferative diabetic retinopathy; PDR, proliferative diabetic retinopathy; DMR, diabetic macular edema. Reference: 1. Liu L, Wu X, Liu L, et al. Prevalence of diabetic retinopathy in mainland China: a meta-analysis. PLoS One. 2012;7:e45264. 2. Lin CC, Li CI, Hsiao CY, et al. Time trend analysis of the prevalence and incidence of diagnosed type 2 diabetes among adults in Taiwan from 2000 to 2007: a population-based study. BMC public health. 2013;13:318. 3. Lin JC, Shau WY, Lai MS. Sex- and age-specific prevalence and incidence rates of sight-threatening diabetic retinopathy in Taiwan. JAMA ophthalmology. 2014;132:922-928. 4. Tu Y, Xu L, Wei WB, Wang S, Wang YX, Jonas JB. Progression of diabetic retinopathy: the Beijing Eye Study. Chin Med J (Engl). 2011;124:3635-3640. 5. Wang FH, Liang YB, Zhang F, et al. Prevalence of diabetic retinopathy in rural China: the Handan Eye Study. Ophthalmology. 2009;116:461-467. 6. Kong CY, McMahon PM, Gazelle GS. Calibration of disease simulation model using an engineering approach. Value Health. 2009;12:521-529. 7. Yeh JM, Kuntz KM, Ezzati M, Hur C, Kong CY, Goldie SJ. Development of an empirically calibrated model of gastric cancer in two high-risk countries. Cancer Epidemiol Biomarkers Prev. 2008;17:1179-1187.
