gcb12111-sup-0007-TableS2
advertisement
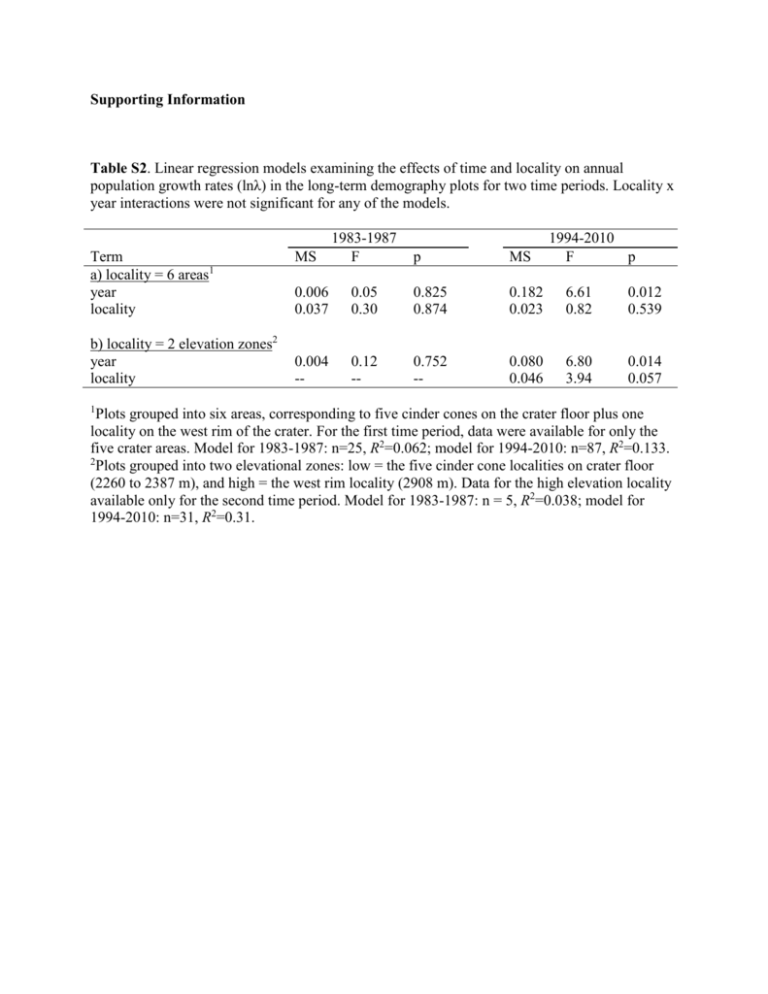
Supporting Information Table S2. Linear regression models examining the effects of time and locality on annual population growth rates (lnλ) in the long-term demography plots for two time periods. Locality x year interactions were not significant for any of the models. Term a) locality = 6 areas1 year locality b) locality = 2 elevation zones2 year locality 1 1983-1987 MS F 1994-2010 F p p MS 0.006 0.037 0.05 0.30 0.825 0.874 0.182 0.023 6.61 0.82 0.012 0.539 0.004 -- 0.12 -- 0.752 -- 0.080 0.046 6.80 3.94 0.014 0.057 Plots grouped into six areas, corresponding to five cinder cones on the crater floor plus one locality on the west rim of the crater. For the first time period, data were available for only the five crater areas. Model for 1983-1987: n=25, R2=0.062; model for 1994-2010: n=87, R2=0.133. 2 Plots grouped into two elevational zones: low = the five cinder cone localities on crater floor (2260 to 2387 m), and high = the west rim locality (2908 m). Data for the high elevation locality available only for the second time period. Model for 1983-1987: n = 5, R2=0.038; model for 1994-2010: n=31, R2=0.31.


