Write the following functions in the equivalent form most appropriate
advertisement
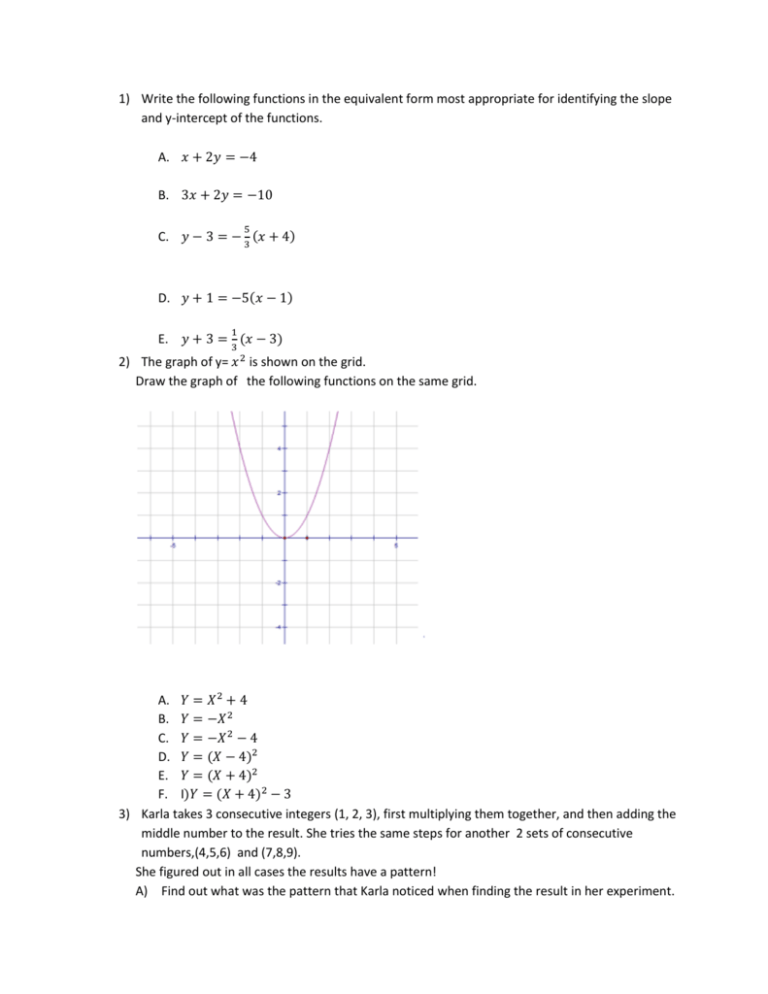
1) Write the following functions in the equivalent form most appropriate for identifying the slope and y-intercept of the functions. A. 𝑥 + 2𝑦 = −4 B. 3𝑥 + 2𝑦 = −10 5 C. 𝑦 − 3 = − 3 (𝑥 + 4) D. 𝑦 + 1 = −5(𝑥 − 1) 1 E. 𝑦 + 3 = 3 (𝑥 − 3) 2) The graph of y= 𝑥 2 is shown on the grid. Draw the graph of the following functions on the same grid. A. 𝑌 = 𝑋 2 + 4 B. 𝑌 = −𝑋 2 C. 𝑌 = −𝑋 2 − 4 D. 𝑌 = (𝑋 − 4)2 E. 𝑌 = (𝑋 + 4)2 F. I)𝑌 = (𝑋 + 4)2 − 3 3) Karla takes 3 consecutive integers (1, 2, 3), first multiplying them together, and then adding the middle number to the result. She tries the same steps for another 2 sets of consecutive numbers,(4,5,6) and (7,8,9). She figured out in all cases the results have a pattern! A) Find out what was the pattern that Karla noticed when finding the result in her experiment. B) Karla made her conjectures and she tries to write a rule for it. What do you think she needs to write as a general rule? C) Juan ,upon hearing of Karla’s observation ,writes his own rule as: (𝑎 + 1)(𝑎 + 2)(𝑎 + 3) +--------------= (𝑎 + 2)3 what should you replace for the missing part? D) Miguel tries to write his own version with “𝑎 “as the middle number, what do you think his formula looks like? 4) San Fernando High School plans to order T-shirts with a new SFHS logo for all students. They realized that because of the fixed cost for the custom SFHS logo the average cost per T-shirt depends on the number of T-shirts ordered. The total cost of ordering x number of T-shirts is given by 𝑐(𝑥) = 250 + 4.25 𝑥 A) Suppose the school orders only 10 T-shirts, what is the total cost? What is the cost of each T- shirt? B) Suppose the school orders 3000 T-shirts, what is the total cost? What is the cost of each Tshirt? C) Seeing the drop of the price per T-shirt made the students curious. “What will happen to the price as we order more and more T-shirts?” In order to answer that question, they decided to make the table below. Complete the table to show the cost per T-shirt for different number of orders. The number of T-shirts Total cost Cost per T-shirt 0 10 100 1000 10,000 Explain why the average cost per T-shirt is changing. Explain why the average cost per T-shirt levels off. 100,000 1000,000 Using the data points from your table, sketch the graph of the average cost per T-shirt. How does the graph reflect the fact that the average cost levels off? 5) The value of an antique has increased exponentially, as shown in the graph above. Based on the graph, estimate to the nearest $50 the average rate of change in value of the antique for the following time intervals: From 0 to 10 years From 10 to 28 years 2 6) Find the inverse of 𝑓(𝑥) = − 3 𝑥 − 1 and graph it on the coordinate grid below. 7) Maria starts a new job with a $40,000 salary and a promise of a $2000 raise every year, while Tina starts with the same salary and is promised a raise of 2-5%. Who would be making more money after 5 years on the job? Explain with reasoning.


