Concavity - Lakeside School
advertisement
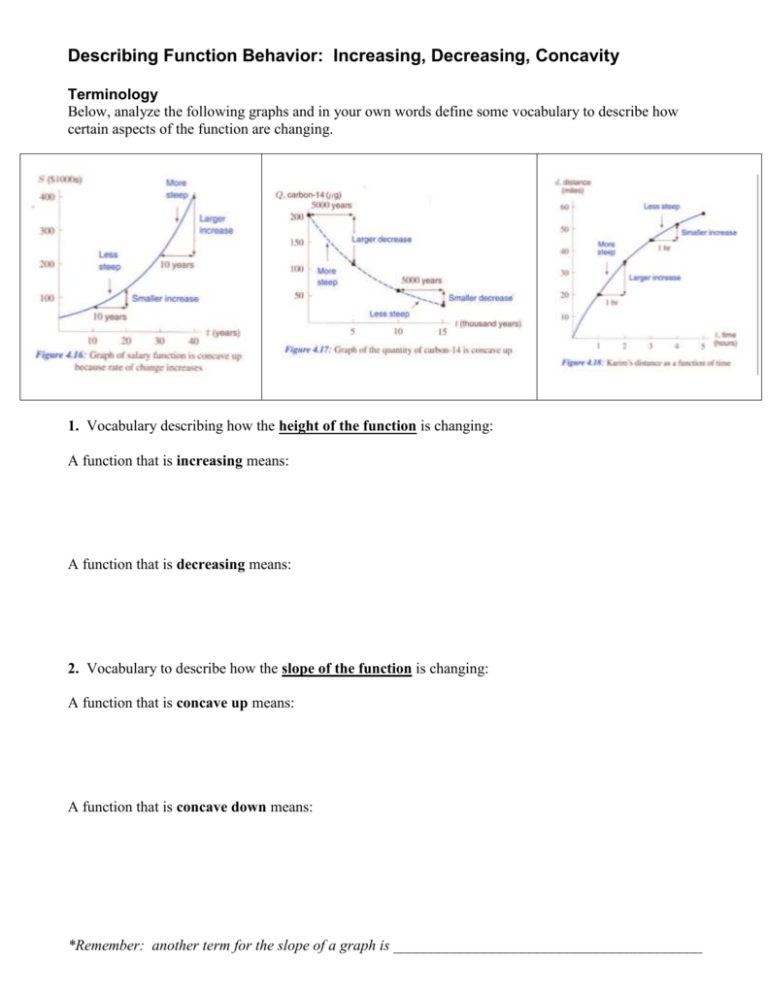
Describing Function Behavior: Increasing, Decreasing, Concavity Terminology Below, analyze the following graphs and in your own words define some vocabulary to describe how certain aspects of the function are changing. 1. Vocabulary describing how the height of the function is changing: A function that is increasing means: A function that is decreasing means: 2. Vocabulary to describe how the slope of the function is changing: A function that is concave up means: A function that is concave down means: *Remember: another term for the slope of a graph is _________________________________________ Definitions: If a function’s average rate of change (slope) increases from left to right, we say that its graph is concave up. (i.e. the graph “bends upward.”) If a function’s average rate of chance (slope) decreases from left to right, we say that its graph is concave down. (i.e. the graph “bends downward.”) If a function has a constant rate of change, its graph is a line (degree 0 or 1 polynomial) and is neither concave up nor concave down. Places where a the graph of a function change concavity are called __________________________ Places where the graph has a slope of zero are called local ______________________, and are essentially local ______________________ and ______________________ points. 3. Draw a quick sketch of the 12 basic functions and write a brief comment on what you observe about the graphs concavity. 4. For the graphs below, discuss the intervals pertaining to concavity and increasing/decreasing. Note: The graphs are both “curvy throughout… i.e. no straight lines and the domain is all real numbers. a. i. Write the intervals on which the graphs have the following characteristics: increasing, decreasing, concave up, concave down. ii. What are the coordinates of any inflection points and local extrema? b. i. Write the intervals on whichthe graphs have the following characteristics: increasing, decreasing, concave up, concave down. ii. What are the coordinates of any inflection points and local extrema? 5. The graph is the function f(x) is show in the figure to the right. Indicate in the table whether each marked point is has a positive, negative, or zero slope and whether the function is concave up, down or neither. Point (+,- or 0) concavity D slope E C A B A C D E F F B 6. The table below shows the number of US military personnel on active duty. a. Does the number of personnel appear to be increasing or decreasing as a function of time? b. Use the information in the table to analyze the concavity of the graph. (Above, we did this with a visual of the graph, think about how you can do this now with just the numbers in the table?) c. Where does the point of inflection appear to be for this data? d. Sketch a graph of the data from 1990 – 1996 and comment on the trend (using our new vocabulary terms). e. If the function behaved in a linear fashion starting in 1995, what would it predict for the number of active military personnel in 2007? How does this compare with the actual number of 1,380,082? f. What would that same linear model predict for the current number of active military personnel in 2011? How does this compare with the actual value of 1,477,896? 7. For each scenario, discuss whether the function described is increasing or decreasing and comment on the concavity of the graph that models these scenarios. a. When money is deposited in the bank, the amount of money increases slowly at first. As the size of the account increases, the amount of money increases more rapidly since the interest on the account is compounded. b. After a cup of hot chocolate is poured, it cools off very rapidly at first, and then cools off more slowly until the temperature of the beverage eventually reaches room temperature. c. When a drug is injected into a person’s bloodstream, the amount of the drug present in the body increases rapidly at first. If the person receives daily injections, the body metabolizes the drug so that the amount of the drug present in the body continues to increase, but at a decreasing rate. Eventually, the quantity of the drug in the bloodstream levels off at some saturation level. d. When a new Apple product is introduced, the number of people who use the product increases slowly at first, and then the rate of increase is faster as more people know about the product. Eventually, the rate of increase slows down again when most people who are interested in the product are already using it. 8. 9. Sketch a graph of a continuous function f ( x ) with the following characteristics: Slope 0 at x 0 and x 4 f ( x ) is increasing on ( ,0) f ( x ) is decreasing on (0, 4) and (4, ) f ( x ) is concave up on (2, 4) f ( x ) is concave down on ( ,2) and (4, )
