Functions of Several Variables
advertisement
Functions of Several Variables
12.1 Functions of Two Variables
Rectangular Coordinate System in 3-Space
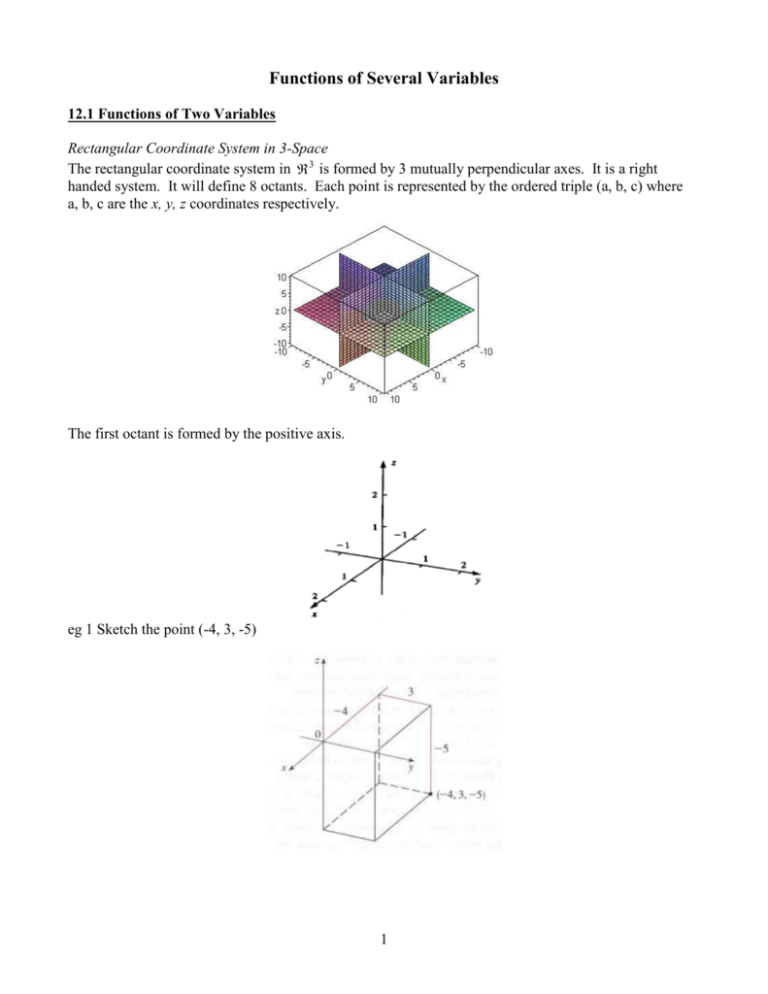
The rectangular coordinate system in 3 is formed by 3 mutually perpendicular axes. It is a right
handed system. It will define 8 octants. Each point is represented by the ordered triple (a, b, c) where
a, b, c are the x, y, z coordinates respectively.
The first octant is formed by the positive axis.
eg 1 Sketch the point (-4, 3, -5)
1
A function of two variables z = f (x, y) is a rule that assigns a number z to each point (x, y) in a portion of
the x-y plane. The function z = f (x, y) represents a surface in 3-space.
Numerical Example of a Function of Two Variables
The wind-chill index (perceived temperature) W is a function temperature T and wind velocity v, so we
can write W = f (T, v) where T is in degree Celsius and v in km/hr.
eg 2. Interpret f (12, 30) = 3 in terms of wind-chill index.
eg 3 Interpret f (16, v) in terms of wind-chill index.
eg 4 Interpret f (T, 40) in terms of wind-chill index.
eg 5 If the temperature is constant, what happens to the perceived temperature as the wind velocity
increases.
eg 6 If the wind is blowing at 20 km/hr, what temperature feels like 0o C.
Algebraic Example of a Function of Two Variables
eg 7 Find a function S(r, h) for the surface area of a cylinder or radius r and height h.
Answer: S (r , h) 2 rh 2 r 2
eg 8 Find a function A(x, y) for the area of the Norman window shown below.
Answer: A( x, y) 2 xy x 2 / 2
2
Simple Surfaces
eg 9 What does the equation x = 2 represent in 2 and 3 ?
eg 10 Describe the set of points (x, y, z) such that y = 5 and z = 3.
eg 11 What does the equation z = 0 represents in 3 ?
eg 12 Describe the region if 3 represented by 0 ≤ z ≤ 10.
eg 13 Describe the region if 2 and 3 represented by x2 + y2 < 1.
eg 14 Describe the regions if 3 represented by x2 + z2 ≤ 4.
Distance between two points
The distance between the points P1 = (x1, y1, z1) and P2 = (x2, y2, z2) is given by
D
x
2
x1 ) 2 ( y2 y1 ) 2 ( z2 z1
2
eg 15 Find the distance from the point P : (4, -5, -1) to the point Q : (3, -2, 3).
eg 16 Which of the points (-1, 3, 2), (-4, -5, 0) or (3, 2, -3) is closest to the x-z plane? Which lies on the
x-y plane?
Midpoint
The midpoint of the line segment from the point (x1, y1, z1) to the point (x2, y2, z2) is given by
x x y y z z
MP 1 2 , 1 2 , 1 2 .
2
2
2
eg 17 Find the midpoint of the line segment from P : (4, -5, -1) to Q : (3, -2, 3).
Spheres
The equation of a sphere with center at (x0, y0, z0) and radius r is given by
(x – x0)2 + (y – y0)2 + (z – z0)2 = r2
The general form of the equation of a sphere is given by
x2+ y2 + z2 +dx +ey + fz + g = 0 where d, e, f, g, are constants.
Not all equations of this type are spheres. If we complete the square we have
(x – x0)2 + (y – y0)2 + (z – z0)2 = k. If k > 0 we have a sphere of radius r = k . If k = 0 we have the point
(x0, y0, z0). If k < 0 we have no real graph.
3
eg 18 Determine the type of graph of:
a. x2 + y2 + z2 + 10x + 4y + 2z + 28 = 0
b. x2 + y2 + z2 + 10x + 4y + 2z + 30 = 0
c. x2 + y2 + z2 + 10x + 4y + 2z + 32 = 0
eg 19 Find the equation of the sphere with center (3, -2, 4) through (7, 2, 1).
What is the intersection with the x-z plane?
eg 20 Find the equation of the sphere with center (3, -2, 4) that touches the x-z plane.
Domain of Functions of Two Variables
The domain of the function of two variables are the values of x and y where the function is defined. The
range of the function is the set of all values of z.
eg 21 The domain of f(x,y) = x / x y 2 is the inside of the sideways parabola y2 = x.
eg 22 The domain of f(x,y) =
x + y – 1 ≥ 0, x +y ≥ 1.
x y 1 is the portion of the x-y plane where
4
eg 23 The domain of f(x, y) = ln (y2 – x) is the portion of the x-y plane where
y2 – x > 0, or the outside of the sideways parabola y2 = x.
eg 24 The domain of f(x, y) =
x2 y 2
is the portion of the x-y plane where
x2 y 2
x2 – y2 > 0 (x – y)(x + y) > 0, or the region bounded the lines x = y and
x = – y where (x – y) and (x + y) are either positive or both negative.
Homework 12.1
1) Which of the points A = (3, 0, 3), B = (0, 4, 2), C = (2, 4, 1), and D = (2, 3, 4) lies closest to
(a) the xy-plane?
(b) the origin?
(c) the y-axis?
(d) the point (1, 2, 3)?
Ans: c,a,b,d
2) In words, describe the surface given by the equation
x 2 y 4 z 6
2
2
2
3
Ans: sphere of radius 3 centered at (2, -4, -6).
3) Sphere A is centered at the origin and the point (0, 0, 5) lies on it. Sphere B is given by the equation
x2 + y2 + z2 = 5. Are the two spheres the same?
Ans: No. Sphere A is larger.
4) What does the equation y = 2 represent in 2 and 3 ?
Ans: line, plane
5
5) Describe the set of points whose distance from the z axis is 3. Ans: Cylinder
6) Describe the set of points whose distance from the z axis equals the distance to the x-y plane.
Ans: pair of cones
1
? (b) What is its global maximum value and at what points does
1 – xy
occur? Ans: The region of the hyperbola xy 1 that includes the origin; none
7) (a) What is the domain of
8) What is the domain of ln(xy)? Ans: The first and third quadrants without the axis
9) What is the domain of f (x, y) = ln (1 – x2 – y2)? Ans: The interior of the unit circle.
10) Find the shortest distance between the point (a,b,c) and the x-axis. Ans: d b2 c2
x
? (b) For what values of x and y is the function positive? For
y
what values of x and y is z negative? For what values of x and y is z zero?
11) (a) What is the domain of z(x, y) =
Ans: a) y 0; b) x>0, x<0, x=0.
2
2
2
12) Find the equation tangent planes to the sphere x 2 y 4 z 6 9 parallel to the yzplane.
Ans: x=5, x=-1
13) The table below gives the equivalent human age A(t, w) of a dog that is t years old and weighs w
pounds. (a) What does A(11,50) represent and, based on the table, what is its approximate value? (b)
What does A(14, 70) represent and what is its approximate value? Ans: {64.5,83}
A(t, w) = EQUIVALENT HUMAN AGE
t=6
t=8
t = 10
t = 12
t = 14
t = 16
w = 20
40
48
56
64
72
80
w = 50
42
51
60
69
78
87
w = 90
45
55
66
77
88
99
12.2 Graphs of Functions of Two Variables
Graphs of functions of two variables, z = f(x, y), can be analyzed using cross-sections.
These are curves obtained when the surface is sliced with planes x = c, y = c or z = c.
We obtain the curves by setting x = c, y = c or z = c(c a constant) in the function.
6
eg 25 Match each function with its graph by using cross sections. You can also use the applet
http://dlippman.imathas.com/g1/fullgrapher3d.html
1. f (x,y) = x3 y
2. f ( x, y ) 4 x 2 y 2
3. f (x, y) = cos(x + y2)
4. f (x, y) = ln (x2 + y2 + 1)
5. f (x, y) = x2
6. f (x, y) =
y
Ans: 1(II), 2(VI), 3(V), 4(I), 5(IV), 6(III)
7
1
+ siny
x 1
Cylindrical Surfaces (Cylinders)
Surfaces generated when a curve on a plane is moved parallel to a line. We obtain cylindrical surfaces
when one variable is missing.
eg 26 Sketch a) y = 5; b) y = x2; c) x2 + z2 = 1; d) z = e− y; e) x + y = 1;
Homework 12.2
1. (a) Is g (x, y) = x3y an increasing or decreasing function of x for y = 10? (b) Is g (x, y) from part
(a) an increasing or decreasing function of y for x = –2. Ans: a) inc. b) dec.
2. What is the global maximum of k (x, y) =
6
and at what point (x, y) does it occur?
x y2 2
2
Ans: 3; (0,0)
3. (a) Describe the intersections of the graph z = x2 + y2 + 6 with the planes x = c, y = c, and z = c
for constants c. (b) Add axes to the surface in the figure below so it represents the graph of
z = x2 + y2 + 6
Ans: x = c and y = c are parabolas that open to the z-axis, z=c is a circle for z > 6.
4. Describe the level curve N (x, y) = 1 of N (x, y) =
x 2y
. Ans: line y 2 x; ( x, y) 0,0 .
3x y
5. Label positive ends of the x- and y-axes in Figure 1 so that the surface has the equation
z= x
Figure 1
Figure 2
8
6. Select positive ends of the x- and y-axes in Figure 2 so that the surface is the graph of
Q (x, y) = 1– y 2
7. Let h( x, t ) 5 4sin x cos( t ) be the distance above the ground (in feet) of a jump rope x
5
feet from one end after t seconds. If the two people turning the rope stand 5 feet apart, then
h(x,1/2) is flat.
Ans: True.
8. Which of the following objects cannot be obtained as the graph of a function of two variables
with a single formula?
a) Paraboloid
b) Plane
c) Cylinder
d) Sphere
e) Line
f) Parabolic cylinder
Ans: (c,d,e)
9. Sketch in 3 a) y = sin(x); b) z = cos(y); c) xy = 1; d) y2 – z2 = 1;
x2 z 2
1 ; f) z = x2 + y2 + 1; g) x2 + y2 = 1;
e)
9 4
10. Describe the surfaces a) z = 4; b) z = 4– x2 – y2 ; c) x2 + y2 +z2 =1.
12.3 Contour Diagrams
Functions of two variables can be represented by graphs and by contour curves.
The level (contour) curves of the function of two variables, z = f(x, y), are curves obtained by slicing a
surface with horizontal planes. Algebraically, we can find them where the function is constant or
z = f(x, y) = k; k a constant.
eg 27 The level curves of the paraboloid that opens downward with vertex at (0, 0, 4)
z = 4 – x2 – y2 are concentric circles with center at (0, 0) including (0, 0).
9
Use the Level Curve Applet http://www.slu.edu/classes/maymk/banchoff/LevelCurve.html to find the
level curves of the paraboloid f(x, y) = x2 + y2
eg 28 (a) Describe the level curves of f(x, y) = x2. The contour map of the function is given below.
f(x, y) = x2 is a parabolic cylinder aligned with the y-axis, and the contour lines are parallel lines. The
closer the lines, the steeper the surface.
eg 28 (b) Describe the level curves of f(x, y) = x2 – y2. The contour map and the table of values of the
function are given below.
The curves are hyperbolas aligned with the x-axis (z > 0), the y-axis (z < 0) or the origin (z = 0).
See an animation at http://www.math.umn.edu/~rogness/mathlets/saddleContour.html
10
Homework 12.3
1. What are the values of P (x, y) = x2 + 4y2 on its three level curves in the figure below?
Ans: Pin = 4; Pmid = 16; Pout = 36
2. What are the values of L (x, y) = x y on its three level curves in the figure below?
Ans: Lin = 1; Lmid = 2; Lout = 3
3. What are the values of K (x, y) =
1
1
2 on its eight level curves in the figure below?
2
x
y
Ans: all Kin = 1/2; all Kout = 2/9
4. Draw (a) the graph of R (x,y) = 4 – x 2 . (b) Describe the level curves where the function of part
(a) has the value 0, 1, and 2.
Ans: Lines x 2, x 3, x 0
5. Which of the following is true?
a) The values of contour lines are always 1 unit apart.
b) Any contour diagram that consists of parallel lines comes from a plane.
c) The contour diagram of any plane consists of parallel lines.
d) Contour lines can never cross.
e) The closer the contours, the steeper the graph of the function.
Ans: (c,e)
11
12.4 Linear Functions
A linear function in 3 will have the form f(x, y) = c + mx + ny, where m is the slope in the x direction,
n is the slope in the y direction and c is the z intercept. The graph of a linear function in 3 is the graph
of a plane.
If the plane passes through the point (x0, y0, z0), the equation of the plane becomes
f(x, y) = z0 + m(x – x0) + n(y – y0).
eg 29 (slope-intercept) Find the equation of the linear function with slope 0 in the direction of the
x-axis, slope – 2 in the direction of the y-axis and cuts the z-axis at z = 4.
Sketch the function. ANS: z = 4 – 2y
eg 30 (point-slope) Find the equation of the linear function with slope – 4 in the direction of the
x-axis, slope – 2 in the direction of the y-axis through the point (1, 2, – 4).
Sketch the function. ANS: z = 4 – 4x – 2y
eg 31 Find the equation of the linear function of the form z = c + mx + ny whose graph intersects the x-y
plane in the line x = –3y –2, and intersects the x-z plane in the line x = –5z –2. ANS: z = –2/5– x/5 + 3y/5
eg 32 (point-slope) Find the equation of the linear function through the points (1, 2, – 1),
(2, 2, 1), (1, –1, 2)
z 3
1.
The points with the same x-coordinates will give the slope in the direction of y; or
y 3
z 2
2.
The points with the same y-coordinates will give the slope in the direction of x; or
x 1
So z = c + 2x – y. We can find c with any of the given points, so z = –1 + 2x – y.
eg 33 Find the equation of the linear function in the table below.
ANS: z = 3x – 4y + 5
eg 34 Draw the plane 2x+3y+6z=12 in the first octant.
12
Contour Maps of Linear Functions
Contour maps of linear functions are parallel lines with equally spaced contour lines.
eg 35 Find a linear function for the contour map below
Starting at (0, 1), one unit in x, decreases z from 6 to 4, so ∆z/∆x = –2. Starting at (0, 1), two units in y,
increases z from 6 to 12, so ∆z/∆y = 3. Since the plane passes through (0, 0, 3) the equation of the plane
is z = 3 – 2x + 3y.
Homework 12.4
1) Find a linear function for the contour map below. Ans: f(x, y) = 2x + 3y + 1.
2) The figure below shows level curves of the function F (x, y) = Ax + By + C. What are the values of
the constants A, B, C? Ans: –2,1,0
13
3) Find equations for linear functions with the given values.
x\y
-1
0
1
2
0
1.5 1 0.5 0
1
3.5 3 2.5 2
2
5.5 5 4.5 4
3
7.5 7 6.5 6
Ans: z=1+2x-y/2
4) Find a linear function for the contour map below.
Ans: z=2x–y+4
5) Which of the following planes are parallel? Ans: (a,c)
(a) z 2 2 x 4 y
(b) z 1 x 2 y
(c) ( z 1) 2 2( x 1) 4( y 1)
(d ) z 2 2 x 4 y
6) True/False: Any three points in 3-space determine a unique plane. Explain.
Ans: False: points cannot be collinear.
7) Find the equation of the plane through the points (1,0,0), (0, –2,0) and (0,0,3).
Ans: 6x–3y+2x=6
8) Sketch the plane z=8–2x–4y.
9) Find the equation of the linear function z = mx+ny+c whose graph intersects the yz-plane in the line
z=3y+5 and the xz-plane in the line z= –2x+5.
Ans: z= –2x+3y+5
14
12.5 Functions of Three Variables
A functions of three variables is a rule that assigns to each ordered triple (x, y, z) a unique value
w = f(x, y, z). These functions are difficult to visualize since they are in 4-space. The temperature T at a
point at an instant of time, can be determined by T = T(x, y, z) for every point in space.
Domain in Three Variables
The domain of the function of three variables are the values of x, y, and z where the function is defined.
The range of the function is the set of all values of w = f(x, y, z).
eg 36 Find the domain of w = z x 2 y 2 .
Since z – x2 – y2 ≥ 0, or z ≥ x2 + y2, the domain is the inside of the paraboloid z = x2 + y2 including the
surface.
1
.
x y z2 1
The domain is inside and outside of the sphere of radius 1 but not the unit sphere.
eg 37 Find the domain of w =
2
2
Quadric Surfaces
A quadric surface is the graph of a second order degree in three variables x, y, z.
The most general form of the quadrics is
Ax2 + By2+Cz2 + Dxy + Eyz + Fxz + Gx + Hy+ Iz + J = 0.
If we neglect rotations we get the form
Ax2 + By2 + Cz2 + Gx + Hy + Iz + J = 0.
If we neglect translations and rotations we get the form
Ax2 + By2 + Cz2 + J = 0.
These are the counter part of the conic sections in the plane.
x2 y 2 z 2
x2 y 2 z 2
x2 y 2
Ellipsoid 2 2 2 1 ; cones 2 2 - 2 0; paraboloid 2 2 z
a b
c
a b
a
b c
2
2
2
x
y
x
y2 z2
Hyperbolic paraboloid 2 2 z ; Hyperboloid one sheet 2 2 2 1
a b
a b c
2
2
2
x
y
z
Hyperboloid two sheets 2 2 2 1
a b c
See the Gallery of Quadric Surfaces at
http://mathdl.maa.org/mathDL/23/?pa=content&sa=viewDocument&nodeId=618&bodyId=985
To analyze the quadrics we can use the traces (conic curves obtained when one of the variables in a
quadrics is replaced by a constant).
x2 y 2 z 2
x2 y 2
eg 38 The traces of the ellipsoid 2 2 2 1 are ellipses 2 2 1 when z = 0; ellipses
a b
c
a
b
2
2
2
2
x
z
y
z
2 1 when y = 0; ellipses 2 2 1 when x = 0.
2
a c
b
c
15
x2 y 2 z 2
x2 y 2
1
1 when z = 0; hyperbolas
are
ellipses
a 2 b2 c 2
a 2 b2
x2 z 2
y2 z2
1 when y = 0; hyperbolas 2 2 1 when x = 0.
a2 c2
b
c
eg 39 The traces of the Hyperboloid
Level Surfaces
We can study functions of three variables by examining its level surfaces, which are surfaces obtained
when c = k a constant.
eg 40 f(x, y, z) = x2 + y2 – z2 = k, is a pair of cones if k = 0, a Hyperboloid of one sheet if k > 0 and a
hyperboloid of 2 sheets if k< 0.
Homework 12.5
1. Sketch the surface x2 + y2 – z2 = K for K = –1 and K = 1.
ANS: [hyp two sheets; hyp one sheet]
2. Sketch z2 = 4x2 + y2 + 8x – 2y + 4z.
ANS: [hyp one sheet c: (-1, 1, 2)]
3. Identify the surface and find the center of x2 – y2 + z2 = –6x + 6y – 4z.
ANS: [hyp one sheet c(-3, -3, -2)]
4. For the surface 36z = 4x2 + 9y2 find the focus and the vertex of the parabolic trace in the plane x = 3.
ANS: [f:(3, 0, 2), v:(3, 0, 1)]
5. Let f(x, y, z) = y2 – x2. Sketch the level surface that passes through the point (1, 2,1) .
Ans: A cylindrical surface of a unit hyperbola along the z-axis.
6. Level surfaces of the function f ( x, y, z ) ( x 2 y 2 ) 1/ 2 are:
(a) Circles centered at the origin.
(b) Spheres centered at the origin.
(c) Cylinders centered around the z-axis.
(d) Upper halves of spheres centered at the origin.
Ans: c
7. Describe the level surfaces of V ( x, y, z ) ln( x 2 y 2 z 2 ) .
Ans: If V=b >0, spheres of radius eb/2 with center at the origin.
8. Can the level surface x 2 y 2 z 2 =1 be expressed as a function z=f(x,y)? Explain
Ans: NO
9. True or false? If false, explain.
(a) Any level surface of a function of 3 variables can be thought of as a surface in 3-space.
(b) Any surface that is a graph of a 2-variable function z = f (x, y) can be thought of as a level
surface of a function of 3 variables.
(c) Any level surface of a function of 3 variables can be thought of as the graph of a function z = f
(x, y).
16
Answer: (F,T,F)
10. Describe in words the level surfaces of F ( x, y, z ) x 2 z 2 1
Ans: F=b>1, concentric cylinders aligned with the y-axis.
12.6 Limits and Continuity
Limits
The function f(x, y) has a limit L at the point (a, b), (
lim
( x, y )( a,b)
f ( x, y) L ) if f ( x, y ) gets close to L
when the distance from the point (x, y) to the point (a, b) is sufficiently small, but not zero.
eg 41
lim
( x , y )( 1 , )
xy 2 sin( xy ) =
2
eg 42
2
2
1
, so the limit does not exist.
( x, y )(0,0) x 2 y 2
lim
2
2r sin(r 2 )
1 cos( x 2 y 2 )
1 cos(r 2 )
lim
0 where a change to
=
=
lim
( x, y )(0,0)
r 0
r 0
2r
( x 2 y2 )
(r 2 )
polar coordinates was made, and L’Hospital rule was applied.
.
eg 43
lim
sin( x 2 y 2 )
sin(r 2 )
lim
1 where a change to polar coordinates was made, and
( x, y )(0,0) ( x 2 y 2 )
r 0
r2
L’Hospital rule was applied.
eg 44
lim
eg 45
lim
( x, y )(0,0)
e
1
x2 y 2
lim
r 0
1
1
er
0 where a change to polar coordinates was made, and
2
L’Hospital rule was applied.
ln( r 2 )
lim
y ln( x y ) = lim r sin( ) ln ( r ) lim sin( )
eg 46
= 0, since |sin(θ)|≤ 1,
1
r 0
( x, y )(0,0)
r 0
r
where a change to polar coordinates was made, and L’Hospital rule was applied.
2
For the
eg 47
lim
( x, y )( a,b)
2
f ( x, y) to exist, the limit along any path containing (a, b) must be the same.
0 if y 0
x2 y
4
2
2
( x, y )(0,0) x y
1/ 2 if y x
lim
2
, so the limit does not exist.
17
eg 48
x 2 y 2 1 if y 0
( x, y )(0,0) x 2 y 2
1 if x 0
eg 49
0 if y 0
xy
2
( x, y )(0,0) 3 x 2 y
1/ 5 if y x
, so the limit does not exist.
lim
lim
, so the limit does not exist.
2
Continuity at a Point
f (x, y) is continuous at the point (x0, y0) if:
1. f (x0, y0) is defined (no holes or jumps)
2. The limit at (x0, y0) exists
3.
lim
( x, y )( x0 , y0 )
f(x, y) = f(x0, y0)
eg 50 f(x, y) = xy2 sin(xy) is continuous at
eg 51 f(x, y) =
1
,
2
lim
( x, y ) 1 ,
2
xy2sin(xy) =
2
2
.
1
is discontinuous at (0, 0) since the function is not defined.
x 2 y2
2
If f(x, y, z) is continuous at the point (x0, y0, z0),
eg 52 Since
since
lim
( x, y , z )( 1 , ,2)
2
xy 2 cos( xyz ) =
lim
( x, y , z )( x0 , y0 , z0 )
f(x, y, z) = f(x0, y0, z0).
2
1
= f ( , , 2) , f ( x, y, z ) xy 2 cos( xy / z ) is continuous at
2
2
1
the point ( , , 2) .
2
eg 53 f(x, y, z) =
1
is discontinuous at (0, 0, 0) since is not defined at that point.
x 2 y2 z2
2
Homework 12.6
1. Use polar coordinates to find the following limits or show that they do not exist:
(a)
lim
lim
( x 2 y 2 ) 2 x3 y 3
xy
lim
x y
;
(b)
;
(c)
( x, y ) (0, 0) x 2 y 2
( x, y) (0, 0)
( x 2 y 2 )2
( x, y) (0, 0) x 2 y 2
Ans: 0, DNE, 1
18
2. Use polar coordinates to find the value of
lim
y
or show that the limit does not exist.
( x, y) (0, 0) x
Ans: DNE
lim
x2 y
3. Show that
does not exist by considering (x, y) that approach (0, 0) along
( x, y ) (0, 0) x 4 y 2
different parabolas.
10 cos( xy )
. Find the global maximum of g(x, y)
1 2 y2
and the values of (x, y) where it occurs. Ans: g(x,0) =10
4. The figure below shows the graph of g(x, y) =
5. Evaluate
a.
c.
lim
( x, y )(0,0)
( x 2 y 2 ) ln( x 2 y 2 )
x2 y 2
lim
( x , y )(0,0)
b.
1 sec2 ( x 2 y 2 )
( x, y )(0,0) 1 cos( x 2 y 2 )
lim
d.
x2 y 2 1 1
Ans: 0,-2, 2
6. Evaluate by considering different paths of approach.
( x y)2
( x, y )(0,0) x 2 y 2
a.
xy
2
( x, y )(0,0) x xy y 2
b.
c.
x 2 3xy y 2
lim
( x, y )(0,0)
x2 2 y 2
x2 y 2
lim 2
d.
( x , y )(0,0) x y 2
e.
lim
x2 y 2
( x, y )(0,0)
xy
f.
lim
7. Where is the function f ( x, y )
lim
x4 y 2
( x, y )(0,0) x 4 y 2
lim
1
discontinuous?
x y2 1
2
Ans: Along the unit circle.
19
2
.
8. Where is the function f ( x, y )
1
discontinuous?
( x 3) ( y 2) 2
2
Ans: at the point (3,-2)
20
