Preliminary Market Data
advertisement

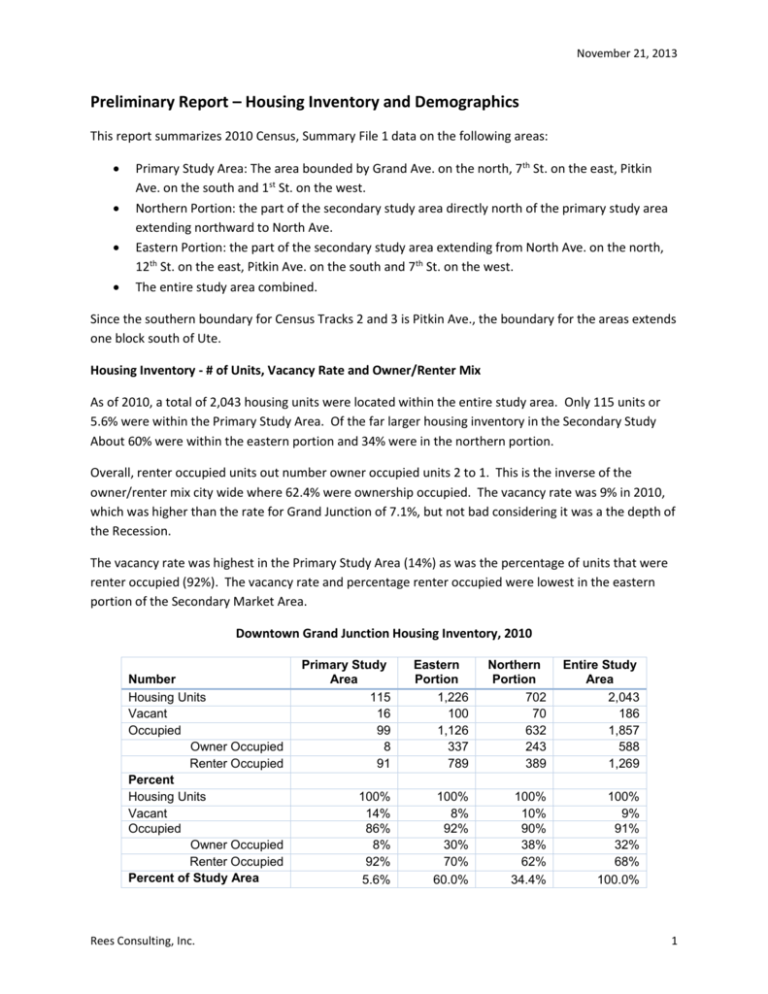
November 21, 2013 Preliminary Report – Housing Inventory and Demographics This report summarizes 2010 Census, Summary File 1 data on the following areas: Primary Study Area: The area bounded by Grand Ave. on the north, 7th St. on the east, Pitkin Ave. on the south and 1st St. on the west. Northern Portion: the part of the secondary study area directly north of the primary study area extending northward to North Ave. Eastern Portion: the part of the secondary study area extending from North Ave. on the north, 12th St. on the east, Pitkin Ave. on the south and 7th St. on the west. The entire study area combined. Since the southern boundary for Census Tracks 2 and 3 is Pitkin Ave., the boundary for the areas extends one block south of Ute. Housing Inventory - # of Units, Vacancy Rate and Owner/Renter Mix As of 2010, a total of 2,043 housing units were located within the entire study area. Only 115 units or 5.6% were within the Primary Study Area. Of the far larger housing inventory in the Secondary Study About 60% were within the eastern portion and 34% were in the northern portion. Overall, renter occupied units out number owner occupied units 2 to 1. This is the inverse of the owner/renter mix city wide where 62.4% were ownership occupied. The vacancy rate was 9% in 2010, which was higher than the rate for Grand Junction of 7.1%, but not bad considering it was a the depth of the Recession. The vacancy rate was highest in the Primary Study Area (14%) as was the percentage of units that were renter occupied (92%). The vacancy rate and percentage renter occupied were lowest in the eastern portion of the Secondary Market Area. Downtown Grand Junction Housing Inventory, 2010 Number Housing Units Vacant Occupied Owner Occupied Renter Occupied Percent Housing Units Vacant Occupied Owner Occupied Renter Occupied Percent of Study Area Rees Consulting, Inc. Primary Study Area 115 16 99 8 91 Eastern Portion 1,226 100 1,126 337 789 Northern Portion 702 70 632 243 389 Entire Study Area 2,043 186 1,857 588 1,269 100% 14% 86% 8% 92% 5.6% 100% 8% 92% 30% 70% 60.0% 100% 10% 90% 38% 62% 34.4% 100% 9% 91% 32% 68% 100.0% 1 November 21, 2013 Household Composition Within the Entire Study Area: The majority of residents are singles. Half are one person households. Couples without kids and other non-family/roommate households are about equal at 16% each. Children reside in only 8% of the occupied units. Within the Primary Study Area: There are proportionately more 1-person households; one person lives alone in about ¾ of the occupied housing units; Roommates live in about 1/3 of the units; The 2010 Census found no children residing there. While the composition of households is very similar in the eastern and northern portions of the Secondary Study Area, the northern portion has slightly fewer single persons living alone (45% compared with 51% in the northern portion). Downtown Grand Junction Households, 2010 Household Type Primary Study Area Eastern Portion Northern Portion Entire Study Area Number All Households 1-Person Living Alone Other Non-Family Households Couple, No Children Couple with Children 99 75 32 8 0 1,126 574 165 176 90 632 286 100 105 50 1,857 935 297 289 140 Percent All Households 1-Person Living Alone Other Non-Family Households Couple, No Children Couple with Children 100% 76% 32% 8% 0% 100% 51% 15% 16% 8% 100% 45% 16% 17% 8% 100% 50% 16% 16% 8% Population and Age The Entire Study Area had a population of 3,417 persons in 2010; 147 persons or just over 4% resided within the Primary Study Area. The Entire Study Area has attracted a Gen Y population with 24% of the overall population in the 20 to 29 age range. This is likely due to the location of Colorado Mesa University just north of the Secondary Rees Consulting, Inc. 2 November 21, 2013 Market Area boundary. Only 20% of the population within the Primary Study Area is within this age range although this is higher than in the city as a whole (16.6%). There is one distinct and very relevant difference in the age distribution between the Primary Study Area and both portions of the Secondary Study Area. In the Primary Study Area, 29% of the population are in the 50 to 59 age range as compared to 16% in the Secondary Study area and less than 14% city wide. This is the same age group that was the first to move in significant numbers into downtown Denver in the late 1980’s and early 90’s. They are typically empty nesters at their income-earning peak who want low maintenance, market rate housing convenient to work. The downtown area has not attracted many seniors. Overall, 10% of the population is age 66 or older. This compares with 15.6% city wide. Downtown Grand Junction Population by Age, 2010 Age Category Primary Study Area Eastern Portion Northern Portion Entire Study Area Number Under 5 years 5 to 19 years 20 to 29 years 30 to 39 years 40 to 49 years 50 to 59 years 60 to 64 years 25 to 64 years 65 to 74 years 75+ years 85+ years Total Population 3 8 30 12 24 43 12 107 12 3 0 147 117 291 517 307 229 338 107 1,193 115 89 24 2,110 71 151 299 196 141 193 58 735 53 53 17 1,215 191 450 846 515 394 574 177 2,035 180 145 41 3,472 Under 5 years 5 to 19 years 20 to 29 years 30 to 39 years 40 to 49 years 50 to 59 years 60 to 64 years 25 to 64 years 65 to 74 years 75+ years 85+ years Total Population 2% 5% 20% 8% 16% 29% 8% 73% 8% 2% 0% 100% 6% 14% 25% 15% 11% 16% 5% 57% 5% 4% 1% 100% 6% 12% 25% 16% 12% 16% 5% 60% 4% 4% 1% 100% 6% 13% 24% 15% 11% 17% 5% 59% 5% 4% 1% 100% Percent Rees Consulting, Inc. 3 November 21, 2013 Race and Ethnicity The study area as a whole has attracted relatively more persons of Hispanic origin than for Grand Junction as a whole (17% compared to 14% of the population) yet this is not the case within the Primary Study area where Hispanics comprise 13% of the population. Downtown Grand Junction Population by Race/Ethnicity, 2010 Number Total Population White Other Races Hispanic or Latino Percent Total Population White Other Races Hispanic or Latino Primary Study Area 147 129 18 19 100% 88% 12% 13% Eastern Portion Northern Portion 2,110 1,784 326 350 1,215 1,043 172 213 Entire Study Area 3,472 2,956 516 582 100% 85% 15% 17% 100% 86% 14% 18% 100% 85% 15% 17% Source: 2010 U.S. Census, Summary File 1 Rees Consulting, Inc. 4


