file - SpringerPlus
advertisement
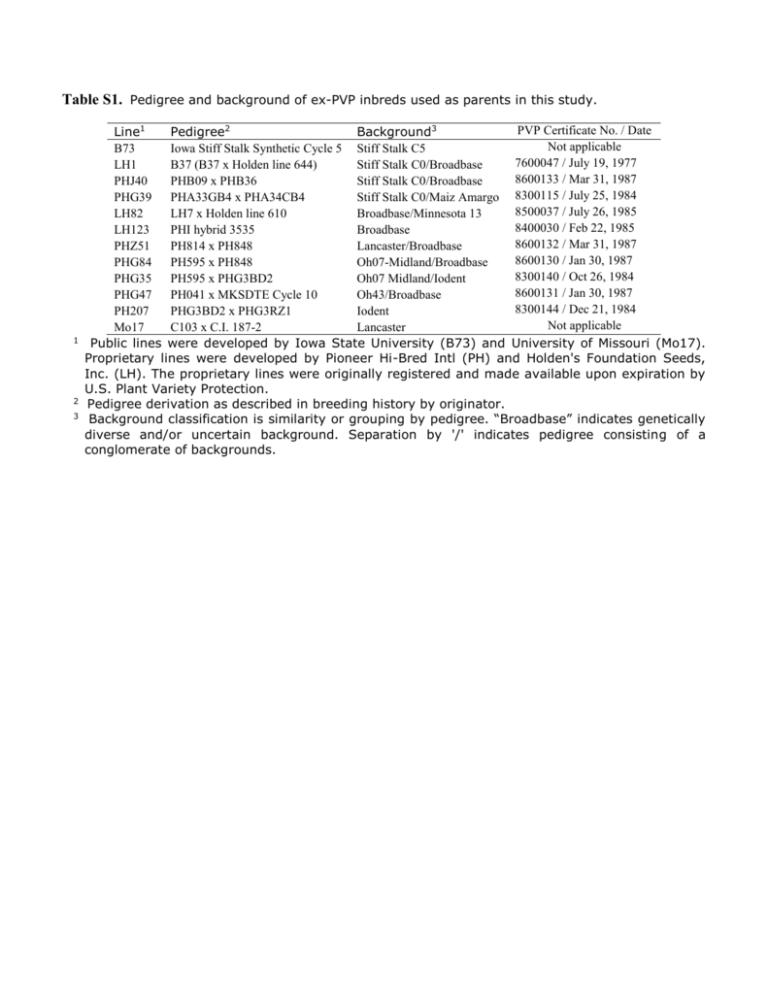
Table S1. Pedigree and background of ex-PVP inbreds used as parents in this study. 1 2 3 PVP Certificate No. / Date Line1 Pedigree2 Background3 Not applicable B73 Iowa Stiff Stalk Synthetic Cycle 5 Stiff Stalk C5 7600047 / July 19, 1977 LH1 B37 (B37 x Holden line 644) Stiff Stalk C0/Broadbase 8600133 / Mar 31, 1987 PHJ40 PHB09 x PHB36 Stiff Stalk C0/Broadbase PHG39 PHA33GB4 x PHA34CB4 Stiff Stalk C0/Maiz Amargo 8300115 / July 25, 1984 8500037 / July 26, 1985 LH82 LH7 x Holden line 610 Broadbase/Minnesota 13 8400030 / Feb 22, 1985 LH123 PHI hybrid 3535 Broadbase 8600132 / Mar 31, 1987 PHZ51 PH814 x PH848 Lancaster/Broadbase 8600130 / Jan 30, 1987 PHG84 PH595 x PH848 Oh07-Midland/Broadbase 8300140 / Oct 26, 1984 PHG35 PH595 x PHG3BD2 Oh07 Midland/Iodent 8600131 / Jan 30, 1987 PHG47 PH041 x MKSDTE Cycle 10 Oh43/Broadbase 8300144 / Dec 21, 1984 PH207 PHG3BD2 x PHG3RZ1 Iodent Not applicable Mo17 C103 x C.I. 187-2 Lancaster Public lines were developed by Iowa State University (B73) and University of Missouri (Mo17). Proprietary lines were developed by Pioneer Hi-Bred Intl (PH) and Holden's Foundation Seeds, Inc. (LH). The proprietary lines were originally registered and made available upon expiration by U.S. Plant Variety Protection. Pedigree derivation as described in breeding history by originator. Background classification is similarity or grouping by pedigree. “Broadbase” indicates genetically diverse and/or uncertain background. Separation by '/' indicates pedigree consisting of a conglomerate of backgrounds. Table S2 Temperature (◦F), precipitation, dryness, evaporation, and water deficit in the 2007 and 2010 Urbana, IL. environments. Max Air Temp1 Min Air Temp2 Avg Temp3 88.7 91.3 96.2 91.3 96.5 96.4 20.8 37.4 48 54.4 58.4 41.1 51.4 69.3 74.8 74.3 77.8 70.4 Average: 72.8 Inches of Rain Fall Total Evap4 Water Deficit5 Days Dry6 2.13 1.54 5.66 3.82 0.87 2.27 4.11 5.96 6.59 7.03 6.32 5.09 -1.98 -4.42 -0.93 -3.21 -5.45 -2.82 9 17 13 11 21 16 11.02 19.58 -8.56 41 1.91 3.09 7.82 3.57 1.58 3.02 4.77 4.42 4.96 5.07 5.17 4.07 -2.86 -1.33 2.86 -1.50 -3.59 -1.05 14 8 3 8 10 7 14.48 14.45 0.03 19 2007 April May June July August September May to July7 Sum: 2010 April May June July August September May to July 1 84.9 92 91.8 94.5 96.3 94.3 32.3 35.1 57.8 55.8 54 45.5 59.2 65 74.8 77.3 77.2 67.5 Average: 72.4 Sum: Maximum air temperature; 2 Minimum air temperature; 3 Average air temperature; 4 Total moisture evaporated in inches; 5 Inches of rainfall – inches of evaporation; 6 number of days in a month with no rain ( < 0.1 inches); 7 The experiment was planted at the beginning of May in both years. Root growth is expected to be completed around flowering, which occurred in July; Data provided by the Illinois State Water Survey (ISWS) located in Champaign and Peoria, Illinois, and on the web at www.isws.illinois.edu. Table S3 Repeatability estimates, and 90% confidence limits for root complexity and architecture traits among 12 inbreds and their 66 F1 crosses. Trait 1 FD FA RA SD Generation F1 Inbred F1 Inbred F1 Inbred F1 Inbred LL 2 0.48 0.72 0.59 0.65 0.65 0.72 0.14 0.00 Repeatability 3 0.67 0.89 0.74 0.87 0.78 0.89 0.39 0.50 UL4 0.73 0.95 0.79 0.93 0.82 0.94 0.54 0.76 1 FDV, fractal dimension; FA, fractal abundance; RA, root angle; SD, stalk diameter in pixels. Lower limit of 90% confidence interval on repeatability calculated as 1 – ((MS ENT/MS GxE)*F distribution inverse(.1, Entry degrees of freedom, GxE degrees of freedom) )^-1 2 3 Repeatability was calculated as 2 𝛿𝑔 2 𝛿2 2 + 𝑔𝑥𝑒+𝛿𝑒𝑟𝑟 𝛿𝑔 𝑟 𝑟𝑒 where genetic variance, 𝛿𝑔2 , was calculated as (MS ENT – MS GxE)/re, variance of the interaction of genotypes with the environment was calculated as (MS GxE – MS ERR)/r, r is the number of replications, and e is the number of environments. The model used to obtain the mean squares for repeatability estimates, Y = Environment + Rep(Environment) + Entry + Entry*Environment + Residual Error, does not take into account the covariance between the hybrids due to common parents. Degrees of freedom for the entries (F1s/inbreds), environment, entry by environment interaction (F1/inbred), replications nested within the environment, and error degrees of freedom (F1/inbred) are (65/11), 1, (62/11), 4, and (253/ 44), respectively. 4 Upper limit of 90% confidence interval on repeatability calculated as 1 – ((MS ENT/MS GxE)*F distribution inverse(.9, Entry degrees of freedom, GxE degrees of freedom) )^-1 Table S4 Order of magnitude obtained by studies applying the box counting method to determine the fractal dimension of roots based on root images. Species Stage [DAP] Box size range [mm] Order of Magnitude1 Wheat 126 0.40 – 21.00 2.00 – 10.00 1.72 0.70 Tatsumi et al. (1989) Manschadi et al. (2008) Rye 126 0.40 – 20.00 1.70 Tatsumi et al. (1989) 2.50 Wang et al. (2009) Rice Study2 126 0.60 – 16.20 1.43 0.60 Tatsumi et al. (1989) Masi and Maranville (1998) 30 0.70 – 19.9 80 1pix – 512pix 1.45 0.60 2.71 Tatsumi et al. (1989) Eghball et al. (1993) This study Millet 30 0.65 – 18.80 1.46 Tatsumi et al. (1989) Garden Pea 58 0.28 – 6.60 1.37 Tatsumi et al. (1989) Peanut 58 0.30 – 6.70 1.34 Tatsumi et al. (1989) 59 pix/cm – 59×10pix/cm 59 pix/cm – 59×10pix/cm 1.00 1.00 Berntson (1994) Berntson (1994) Sorghum Maize Betula populifolia Betula alleghaminsis 1 2 Order of Magnitude was calculated as log10 (𝑠𝑚𝑎𝑥 / 𝑠min), with smax and smin are the largest and smallest box size used, respectively. Berntson, G.M., 1994 Root systems and fractals: How reliable are calculations of fractal dimensions? Annals of Botany 73:281-284. Eghball, B., J.R. Settimi, J.W. Maranville, and A.M. Parkhurst, 1993. Fractal analysis for morphological description of corn roots under nitrogen stress. Agron J. 85:287-289. Masi, C. E. A., and J. W. Maranville, 1998 Evaluation of sorghum root branching using fractals. Journal of Agricultural Science, Cambridge 131: 259-265. Manchadi, M.M., G.L. Hammer, J.T. Christopher, and P. deVoil, 2008. Genotypic variation in seedling root architectural traits and implications for drought adaptation in wheat (Triticum aestivum L.). Plant and Soil 303:115-129. Tatsumi, J., A. Yamauchi, and Y. Kono, 1989 Fractal analysis of plant root systems. Ann Bot 64: 499-503. Wang, H., J. Siopongco, L. J. Wade, and A. Yamauchi, 2009 Fractal analysis on root systems of rice plants in response to drought stress. Environmental and Experimental Botany 65: 338-344. Fig. S1 Chart of genetic effects and mid-parent values for the FD trait among the experimental F1s, sorted from lowest to highest performance. The Y-axis scale is in the dimensionless units of the FD trait. Black, grey, and blue bars are the magnitude of the additive, GCA, and SCA effects for the hybrids, respectively. Blue and black dots are F1 least square means and mid-parent values, respectively. The dashed blue line and solid black line are the means of the F1 and inbred generations. SS, SN, and NN labels affixed to the hybrid names indicate stiff stalk x stiff stalk, stiff stalk x non-stiff stalk (or non-stiff stalk x stiff stalk), and non-stiff stalk by non-stiff stalk hybrid combinations. Individual effect significances are not reported. Overall significance of additive effects per se, GCA, SCA, and total heterosis (F1 mean – Inbred mean) is provided in the text of the article. Fig. S2 Chart of genetic effects and mid-parent values for the FA trait among the experimental F1s, sorted from lowest to highest performance. The Y-axis scale is in the dimensionless units of the FA trait. Black, grey, and blue bars are the magnitude of the additive, GCA, and SCA effects for the hybrids, respectively. Blue and black dots are F1 least square means and mid-parent values, respectively. The dashed blue line and solid black line are the means of the F1 and inbred generations. SS, SN, and NN labels affixed to the hybrid names indicate stiff stalk x stiff stalk, stiff stalk x non-stiff stalk (or non-stiff stalk x stiff stalk), and non-stiff stalk by non-stiff stalk hybrid combinations. Individual effect significances are not reported. Overall significance of additive effects per se, GCA, SCA, and total heterosis (F1 mean – Inbred mean) is provided in the text of the article. Fig. S3 Chart of genetic effects and mid-parent values for the RA trait among the experimental F1s, sorted from lowest to highest performance. The Y-axis scale is in degrees. Black, grey, and blue bars are the magnitude of the additive, GCA, and SCA effects for the hybrids, respectively. Blue and black dots are F1 least square means and mid-parent values, respectively. The dashed blue line and solid black line are the means of the F1 and inbred generations. SS, SN, and NN labels affixed to the hybrid names indicate stiff stalk x stiff stalk, stiff stalk x non-stiff stalk (or non-stiff stalk x stiff stalk), and non-stiff stalk by non-stiff stalk hybrid combinations. Individual effect significances are not reported. Overall significance of additive effects per se, GCA, SCA, and total heterosis (F1 mean – Inbred mean) is provided in the text of the article. Fig. S4 Chart of genetic effects and mid-parent values for the SD trait among the experimental F1s, sorted from lowest to highest performance. The Y-axis scale width in pixels. Black, grey, and blue bars are the magnitude of the additive, GCA, and SCA effects for the hybrids, respectively. Blue and black dots are F1 least square means and mid-parent values, respectively. The dashed blue line and solid black line are the means of the F1 and inbred generations. SS, SN, and NN labels affixed to the hybrid names indicate stiff stalk x stiff stalk, stiff stalk x non-stiff stalk (or non-stiff stalk x stiff stalk), and non-stiff stalk by non-stiff stalk hybrid combinations. Individual effect significances are not reported. Overall significance of additive effects per se, GCA, SCA, and total heterosis (F1 mean – Inbred mean) is provided in the text of the article. Fig. S5 Scatter plot comparing PC1 (plot A) and PC2 (plot B) loadings obtained from experiments testing 66 F1 hybrids under low nitrogen (“No N Added”) and normal (“Normal Fertility”) nitrogen fertilization.
