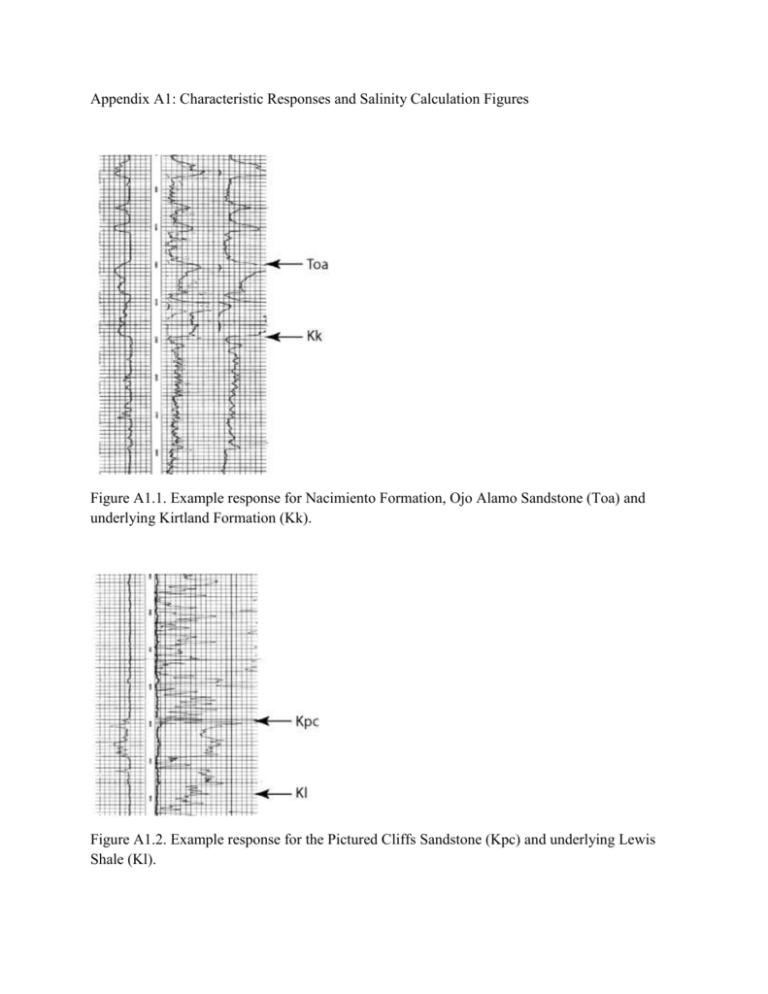
Figure A1.1. Example response for Nacimiento Formation, Ojo
advertisement

Appendix A1: Characteristic Responses and Salinity Calculation Figures Figure A1.1. Example response for Nacimiento Formation, Ojo Alamo Sandstone (Toa) and underlying Kirtland Formation (Kk). Figure A1.2. Example response for the Pictured Cliffs Sandstone (Kpc) and underlying Lewis Shale (Kl). Figure A1.3. Example responses for the Mesaverde Group: Cliffhouse Sandstone (Kch), Menefee Formation (Kmf) and Point Lookout Sandstone (Kpl). Figure A1.4. Example responses for the Greenhorn Limestone (Kgh) and Dakota Sandstone (Kd). Note inverted SP response indicating very fresh pore fluids. Figure A1.5. Example response for the Morrison Formation, Entrada Formation (Je) and upper Chinle Formation (TrC). Figure A1.6. Chart used for determining Rmf/Rwe from spontaneous potential responses and unit temperature. From Asquith and Krygowski (2004). FigureA1.7x. Chart used for determining pore fluid salinity from unit fluid resistivity and temperature. From Asquith and Krygowski (2004).