Open File - The Scottish Government
advertisement
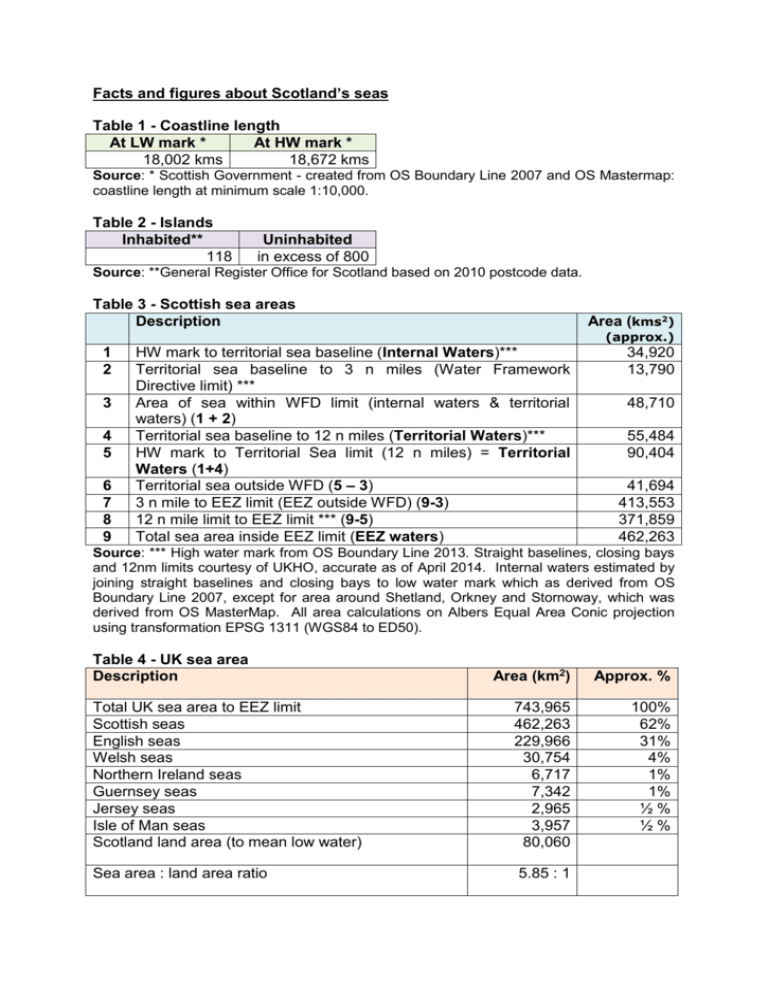
Facts and figures about Scotland’s seas Table 1 - Coastline length At LW mark * At HW mark * 18,002 kms 18,672 kms Source: * Scottish Government - created from OS Boundary Line 2007 and OS Mastermap: coastline length at minimum scale 1:10,000. Table 2 - Islands Inhabited** 118 Uninhabited in excess of 800 Source: **General Register Office for Scotland based on 2010 postcode data. Table 3 - Scottish sea areas Description Area (kms2) (approx.) 1 2 3 4 5 6 7 8 9 HW mark to territorial sea baseline (Internal Waters)*** Territorial sea baseline to 3 n miles (Water Framework Directive limit) *** Area of sea within WFD limit (internal waters & territorial waters) (1 + 2) Territorial sea baseline to 12 n miles (Territorial Waters)*** HW mark to Territorial Sea limit (12 n miles) = Territorial Waters (1+4) Territorial sea outside WFD (5 – 3) 3 n mile to EEZ limit (EEZ outside WFD) (9-3) 12 n mile limit to EEZ limit *** (9-5) Total sea area inside EEZ limit (EEZ waters) 34,920 13,790 48,710 55,484 90,404 41,694 413,553 371,859 462,263 Source: *** High water mark from OS Boundary Line 2013. Straight baselines, closing bays and 12nm limits courtesy of UKHO, accurate as of April 2014. Internal waters estimated by joining straight baselines and closing bays to low water mark which as derived from OS Boundary Line 2007, except for area around Shetland, Orkney and Stornoway, which was derived from OS MasterMap. All area calculations on Albers Equal Area Conic projection using transformation EPSG 1311 (WGS84 to ED50). Table 4 - UK sea area Description Area (km2) Approx. % Total UK sea area to EEZ limit Scottish seas English seas Welsh seas Northern Ireland seas Guernsey seas Jersey seas Isle of Man seas Scotland land area (to mean low water) 743,965 462,263 229,966 30,754 6,717 7,342 2,965 3,957 80,060 100% 62% 31% 4% 1% 1% ½% ½% Sea area : land area ratio 5.85 : 1 Table 5 – Scottish Marine Regions Region Area (km2) Distance along MHWS (km)* Solway 3,724 774 Clyde 4,279 1,251 Argyll 12,045 2,907 Outer Hebrides 20,849 3,900 West Highlands 10,421 3,642 North Coast 2,443 542 Orkney Islands 9,256 1,224 Shetland Isles 12,310 2,373 Moray Firth 5,876 981 North East 3,153 306 Forth and Tay 4,487 772 (Rockall)** 1,561 Total 90,404 18,672 *This includes skerries, islets etc **Rockall has 12nm limit but is not included within SMRs Area and distances calculated on Europe Albers Equal Area Conic projection (ESRI:102013) using transformations EPSG:1311 (Rockall) and EPSG:1315 (SMRs), and rounded to zero decimal places. Notes The baseline (from which the limits of the Territorial Sea are measured) will move depending on the latest surveys of the low water (LW) mark. LW is generally the datum for baselines except where straight baselines (established in legislation) or bay closing lines are used. The areas defined as “bays” vary over time due to improvements in surveys and GIS software. The new Exclusive Economic Zone (EEZ), declared in March 2014, established a new boundary that generally follows the existing continental shelf limits (except in the area beyond 200 miles). This gives a slightly reduced sea area compared with the area within the previous fishery limits. The area of sea will vary depending on the resolution of the coastline used in calculations. A higher resolution coastline introduces more variations – indents or extrusions - which are smoothed out when using a more generalized coast line. When measuring Scotland’s sea area, a higher resolution coastline introduces more small islands which has the effect of increasing coastline length but reducing the sea area. May 2014 Updated May 2015 to add Table 5
