WOW_UHI
advertisement
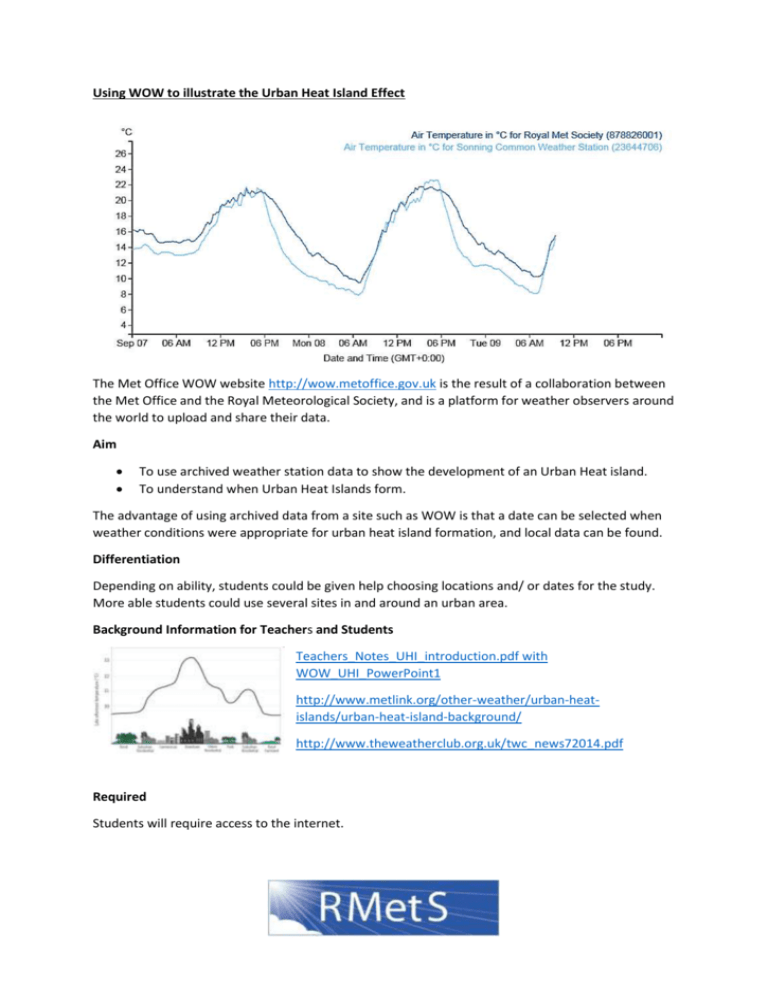
Using WOW to illustrate the Urban Heat Island Effect The Met Office WOW website http://wow.metoffice.gov.uk is the result of a collaboration between the Met Office and the Royal Meteorological Society, and is a platform for weather observers around the world to upload and share their data. Aim To use archived weather station data to show the development of an Urban Heat island. To understand when Urban Heat Islands form. The advantage of using archived data from a site such as WOW is that a date can be selected when weather conditions were appropriate for urban heat island formation, and local data can be found. Differentiation Depending on ability, students could be given help choosing locations and/ or dates for the study. More able students could use several sites in and around an urban area. Background Information for Teachers and Students Teachers_Notes_UHI_introduction.pdf with WOW_UHI_PowerPoint1 http://www.metlink.org/other-weather/urban-heatislands/urban-heat-island-background/ http://www.theweatherclub.org.uk/twc_news72014.pdf Required Students will require access to the internet. How to Use WOW Go to the WOW website wow.metoffice.gov.uk To select an archived date, slide the time bar to the far left hand side. A calendar and drop down time menu will then appear to let you select a date and time. Zoom in to find appropriate weather stations. Click on the weather station. A pop-up box will appear, giving you some information about the site (for example its star rating). Click on ‘View Observation’ and then on either ‘table’ or ‘graph view’. You may like to change the tick boxes such that only Air Temperature is selected, and alter the date range shown. If you make a note of the site ID, in graph view you can then compare its recorded temperature with those from another site. Choosing locations Students should select two locations, one in an inner city area and one in a rural area just outside the city. They might like to make sure that the sites they choose are submitting high quality data (we would recommend using sites with at least 2 stars). Students could use Google Earth to check the land use of the place where the weather is being recorded. Advanced students might like to use an OS map to check whether there is a substantial height difference between the sites, and should consider whether this will have an effect on the temperatures recorded. Choosing a Date and time The Urban Heat Island is biggest: • At night (before sunrise) • In the summer • When there is no wind (<5m/s) • When the sky is clear • When the weather doesn’t change through the night Plenary Use WOW_UHI_PowerPoint2.ppt . Ask students to line up across room as a continuum. Students should stand at the left if they think their experiment does provide evidence for an urban heat island, and the right if they think it does not, or somewhere in between.
