DataStructure
advertisement
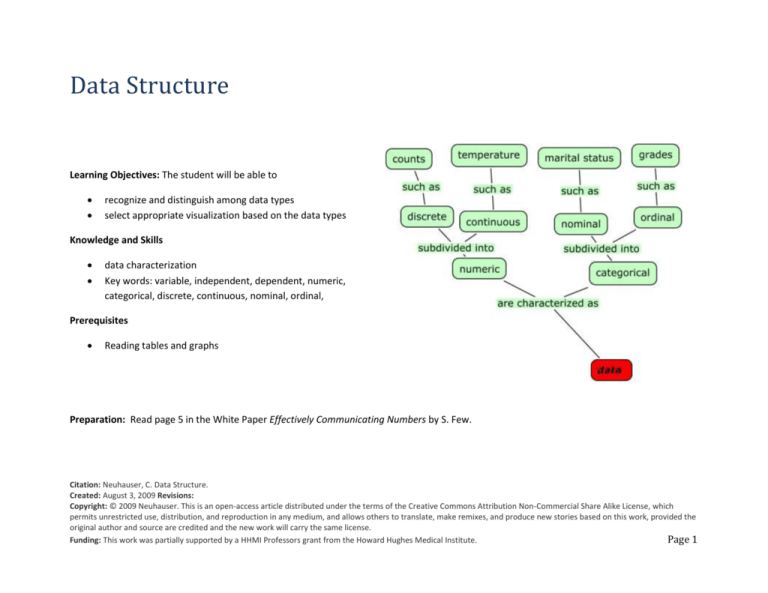
Data Structure Learning Objectives: The student will be able to recognize and distinguish among data types select appropriate visualization based on the data types Knowledge and Skills data characterization Key words: variable, independent, dependent, numeric, categorical, discrete, continuous, nominal, ordinal, Prerequisites Reading tables and graphs Preparation: Read page 5 in the White Paper Effectively Communicating Numbers by S. Few. Citation: Neuhauser, C. Data Structure. Created: August 3, 2009 Revisions: Copyright: © 2009 Neuhauser. This is an open-access article distributed under the terms of the Creative Commons Attribution Non-Commercial Share Alike License, which permits unrestricted use, distribution, and reproduction in any medium, and allows others to translate, make remixes, and produce new stories based on this work, provided the original author and source are credited and the new work will carry the same license. Funding: This work was partially supported by a HHMI Professors grant from the Howard Hughes Medical Institute. Page 1 A variable is any characteristic or attribute that differs for different subjects. Examples include income, age, height, mortality rate, etc. We distinguish between independent and dependent variables. If a variable is manipulated by the investigator, it is independent; if it is measured, it is dependent. For instance, if we wanted to know the median income in a set of countries, the investigator would set up a spreadsheet with three columns, one for “Country,” one for the “Year” when the data was collected, and one for “Median household income.” The investigator selects the country and the year, and then “measures” the median income for each of the selected countries in Purchasing Power Parity (PPP): Country Switzerland Canada United States New Zealand United Kingdom Australia Israel Singapore Year 2005 2005 2006 2007 2004 2006 2006 2005 Median household income (PPP) $55,000 $44,000 $48,000 $41,000 $39,000 $38,000 $37,000 $30,000 The variable “Country” and the variable “Year” are the independent variables, and “Median household income (PPP)” is the dependent variable. A set of data describes characteristics of a population or a sample. Each characteristic is a variable. Data are classified into different categories according to numeric and categorical. Numeric data are either discrete or continuous. Discrete data can be counted, for instance, the number of patients in a study who are male. Continuous data can take on any value in a finite or infinite interval, for instance, temperature measured in Kelvin can take on any value greater than or equal to 0. Citation: Neuhauser, C. Data Structure. Created: August 3, 2009 Revisions: Copyright: © 2009 Neuhauser. This is an open-access article distributed under the terms of the Creative Commons Attribution Non-Commercial Share Alike License, which permits unrestricted use, distribution, and reproduction in any medium, and allows others to translate, make remixes, and produce new stories based on this work, provided the original author and source are credited and the new work will carry the same license. Funding: This work was partially supported by a HHMI Professors grant from the Howard Hughes Medical Institute. Page 2 Data are categorical if they can be sorted into categories. Categorical data cannot be measured, though they can be assigned a code. For instance, male could be assigned 0 and female 1. Nominal data can only be compared but cannot be ordered, whereas ordinal data can be ordered. Resources http://www.stats.gla.ac.uk/steps/glossary/presenting_data.html# http://cnx.org/content/m16007/latest/ In-class Activities In-class Activity 1: Mohs scale of mineral hardness is listed in the following table. According to the American Federation of Mineralogical Societies, Inc., Mohs scale was devised in 1812 “by the German mineralogist Frederich Mohs (1773-1839), who selected the ten minerals because they were common and readily available. The scale is not a linear scale, but somewhat arbitrary” (http://www.amfed.org/t_mohs.htm). Mineral Talc Gypsum Calcite Fluorite Apatite Orthoclase Quartz Topaz Corundum Diamond Hardness 1 2 3 4 5 6 7 8 9 10 Citation: Neuhauser, C. Data Structure. Created: August 3, 2009 Revisions: Copyright: © 2009 Neuhauser. This is an open-access article distributed under the terms of the Creative Commons Attribution Non-Commercial Share Alike License, which permits unrestricted use, distribution, and reproduction in any medium, and allows others to translate, make remixes, and produce new stories based on this work, provided the original author and source are credited and the new work will carry the same license. Funding: This work was partially supported by a HHMI Professors grant from the Howard Hughes Medical Institute. Page 3 Categorize the data type of the variable “Hardness” according to one of the four categories a. b. c. d. discrete numeric continuous numeric nominal categorical ordinal categorical In-class Activity 2: The spreadsheet “GarfinkelCardiacData” contains data on 220 men and 338 women who participated in a study to determine whether the drug “dobutamine” could be used to assess a patient’s risk of a heart attack. For each column in the spreadsheet determine the type of data according to the four categories (a) discrete numeric , (b) continuous numeric , (c) nominal categorical , or (d) ordinal categorical, by checking the appropriate box in the table in the spreadsheet (Table tab). Citation: Neuhauser, C. Data Structure. Created: August 3, 2009 Revisions: Copyright: © 2009 Neuhauser. This is an open-access article distributed under the terms of the Creative Commons Attribution Non-Commercial Share Alike License, which permits unrestricted use, distribution, and reproduction in any medium, and allows others to translate, make remixes, and produce new stories based on this work, provided the original author and source are credited and the new work will carry the same license. Funding: This work was partially supported by a HHMI Professors grant from the Howard Hughes Medical Institute. Page 4 Homework 1. A discrete numeric variable can only take on finitely many values. a. TRUE b. FALSE 2. Measurement of a continuous variable is always a discrete approximation. a. TRUE b. FALSE 3. The variable “World Population” in the following table is a. a discrete numeric variable b. a continuous numeric variable c. a nominal categorical variable d. an ordinal categorical variable Total Midyear Population Year World Population 1950 2,555,955,393 3,041,685,851 3,711,996,957 4,452,557,135 5,284,486,614 6,092,409,072 1960 1970 1980 1990 2000 4. A survey asks you to assign a value from 1 to 5 to rate your satisfaction with a book you recently bought online. The variable “satisfaction” is Citation: Neuhauser, C. Data Structure. Created: August 3, 2009 Revisions: Copyright: © 2009 Neuhauser. This is an open-access article distributed under the terms of the Creative Commons Attribution Non-Commercial Share Alike License, which permits unrestricted use, distribution, and reproduction in any medium, and allows others to translate, make remixes, and produce new stories based on this work, provided the original author and source are credited and the new work will carry the same license. Funding: This work was partially supported by a HHMI Professors grant from the Howard Hughes Medical Institute. Page 5 a. b. c. d. a discrete numeric variable a continuous numeric variable a nominal categorical variable an ordinal categorical variable 5. The variable “mode of transportation to work” is a. a discrete numeric variable b. a continuous numeric variable c. a nominal categorical variable d. an ordinal categorical variable 6. The graph below displays the gross domestic expenditure as a percentage of GDP (vertical axis) for different countries (horizontal axis). The variable “Country” is a. a discrete numeric variable b. a continuous numeric variable c. a nominal categorical variable d. an ordinal categorical variable Citation: Neuhauser, C. Data Structure. Created: August 3, 2009 Revisions: Copyright: © 2009 Neuhauser. This is an open-access article distributed under the terms of the Creative Commons Attribution Non-Commercial Share Alike License, which permits unrestricted use, distribution, and reproduction in any medium, and allows others to translate, make remixes, and produce new stories based on this work, provided the original author and source are credited and the new work will carry the same license. Funding: This work was partially supported by a HHMI Professors grant from the Howard Hughes Medical Institute. Page 6 Source: http://titania.sourceoecd.org/vl=1309619/cl=23/nw=1/rpsv/factbook2009/07/01/01/07-01-01-g1.htm 7. The graph below displays the U.S. population pyramid. The population size for male and female are on the horizontal axis and the age classes are on the vertical axis. The variable “Age” in the graph Population (in millions) of the United States: 2005 is a. a discrete numeric variable b. a continuous numeric variable c. a nominal categorical variable d. an ordinal categorical variable Citation: Neuhauser, C. Data Structure. Created: August 3, 2009 Revisions: Copyright: © 2009 Neuhauser. This is an open-access article distributed under the terms of the Creative Commons Attribution Non-Commercial Share Alike License, which permits unrestricted use, distribution, and reproduction in any medium, and allows others to translate, make remixes, and produce new stories based on this work, provided the original author and source are credited and the new work will carry the same license. Funding: This work was partially supported by a HHMI Professors grant from the Howard Hughes Medical Institute. Page 7 Source: http://www.census.gov/ipc/www/idb/pyramids.html 8. In Problems 3, 6, and 7, list all variables and determine for each variable whether it is an independent or a dependent variable. a. Problem 3: b. Problem 6: c. Problem 7: 9. Read pages 6-9 in the White Paper Effectively Communicating Numbers by S. Few. (This paper will be a constant companion throughout the course.) Citation: Neuhauser, C. Data Structure. Created: August 3, 2009 Revisions: Copyright: © 2009 Neuhauser. This is an open-access article distributed under the terms of the Creative Commons Attribution Non-Commercial Share Alike License, which permits unrestricted use, distribution, and reproduction in any medium, and allows others to translate, make remixes, and produce new stories based on this work, provided the original author and source are credited and the new work will carry the same license. Funding: This work was partially supported by a HHMI Professors grant from the Howard Hughes Medical Institute. Page 8 References Few, S. 2005. Effectively Communicating Numbers. Principal Perceptual Edge. White Paper. Downloaded from http://www.perceptualedge.com/library.php#Whitepapers Citation: Neuhauser, C. Data Structure. Created: August 3, 2009 Revisions: Copyright: © 2009 Neuhauser. This is an open-access article distributed under the terms of the Creative Commons Attribution Non-Commercial Share Alike License, which permits unrestricted use, distribution, and reproduction in any medium, and allows others to translate, make remixes, and produce new stories based on this work, provided the original author and source are credited and the new work will carry the same license. Funding: This work was partially supported by a HHMI Professors grant from the Howard Hughes Medical Institute. Page 9
