Model of consumer behavior - Cal State LA
Model of consumer behavior
Scarcity forces consumers to live under budget constraint
Consumers choose basket of goods/services the maximizes well-being subject to constraint
Budget Constraint
In real life consumer chooses among many goods
Model will show choices open to consumer choosing between two homogeneous goods
1. Food (in pounds)
2. Shelter (in square yards)
Consumption is a flow for both goods
Consumer must choose basket that satisfy:
Expenditures ≤ income
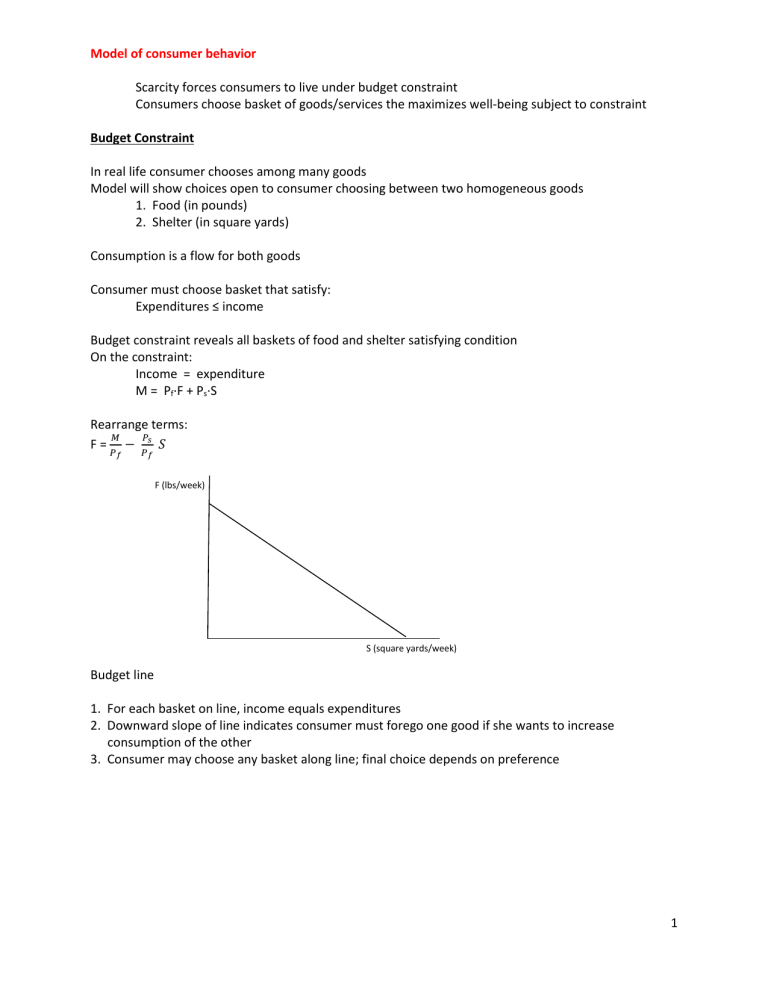
Budget constraint reveals all baskets of food and shelter satisfying condition
On the constraint:
Income = expenditure
M = P f
·F + P s
·S
Rearrange terms:
F =
𝑀
𝑃 𝑓
−
𝑃 𝑠
𝑃 𝑓
𝑆
F (lbs/week)
S (square yards/week)
Budget line
1. For each basket on line, income equals expenditures
2. Downward slope of line indicates consumer must forego one good if she wants to increase consumption of the other
3. Consumer may choose any basket along line; final choice depends on preference
1
Suppose
Budget line:
F =
𝑀
𝑃 𝑓
−
𝑃 𝑠
𝑃 𝑓
𝑆
F = 10 – ½ S
M = $100/week
P s
= $5/sq yd
P f
= $10/pound
F (lbs/week) a c b
(Shelter, Food)
3 5
S (square yards/week)
Baskets a? b?
What is total expenditure on basket c?
Slope of budget line
Represents rate consumer can substitute one good for another holding total expenditure constant
∆𝐹
∆𝑆
=
−𝑃
𝑆
𝑃
𝐹
= − 1 2
For each additional square yard of shelter consumer rents per week, must give up ½ pound of food
Budget line slope illustrates marginal tradeoffs consumer can make in market
Determined by relative prices
Relevance…
∆ Price
Shelter price rises from $5 to $10 per square yard
1. Rate at which consumer can substitute between goods has changed: −
𝑃
𝑆
𝑃
𝐹
Opportunity cost of acquiring additional unit of shelter has increased
2. All baskets (except one) are now smaller on new budget line
∆ Price
Consumer real income has changed, though nominal unchanged
1. P
S
decreases from $5 to $1
2. P
S
increases from $5 to $20
3. P
F increases from $10 to $40
∆ Income
= −1
2
Composite Good
Budget line can illustrate choices open to consumer for one good relative to remaining budget
Y
M
Y – composite good
A collection of all goods except one (good X)
Price of Y normally set to $1/unit
M/P x X
Kinked Budget Line
Think of a good whose price changes for different units purchased
Suppose price of good X decreases after first unit purchased
Marginal tradeoff changes after initial unit purchased
Y
M
1 M/P x
What happened to price of X after first unit acquired?
Show budget constraint if price went in other direction after first unit.
Examples
X
3
Consumer Preference
Assuming consumer exhausts income, he will choose basket on budget constraint the maximizes wellbeing
Consumer ability to choose such basket based on three assumptions regarding decision-making
1. Completeness
Consumer is able to rank all possible combinations of goods and services
The consumer comparing baskets I and J; three possible scenarios
Y
I
1. Consumer prefers I to J or
2. Consumer prefers J to I or
3. Consumer indifferent between baskets
J
X
2. Transitivity
Suppose consumer ranks baskets as: most preferred →
I J
Y
I least preferred
K
If consumer prefers I to J
And prefers J to K
Must prefer I to K
K
J
X
Consumer preference does not reverse
4
3. More is Better
Consumer will always prefer basket L to basket I
Y
L
I
X
Experiment suggesting violation of assumptions
Utility – well-being that in economics arises from consumption of goods and services
People normally consume many goods/services
x
1
……..x
n
Mathematical representation
U = U(X
1,
X
2
,……X n
)
An explicit function may be used to represent relationship between consumption and well-being
Consumer can be modeled as if she is maximizing a mathematical function
Suppose:
Consumer derives utility from food and shelter consumption
U = U(food, shelter) food - F shelter - S
Assume the explicit function
U = U(F,S) = F·S
Characteristics of individual consumer’s behavior
1. Consumer well-being increases with consumption of either good
𝜕𝑈(𝐹,𝑆)
𝜕𝐹
> 0
𝜕𝑈(𝐹,𝑆)
𝜕𝑆
> 0
Marginal utility - change in utility resulting from a incremental change in consumption of a good
Marginal utility of food - MU
F
=
𝜕𝑈(𝐹,𝑆)
𝜕𝐹
Marginal utility of shelter - MU
S
=
𝜕𝑈(𝐹,𝑆)
𝜕𝑆
2. Consumer must consume some of each good in order to derive any utility
U = U(F,S) = F·S if F=0 then U(F,S)=0 if S=0 then U(F,S)=0
Compare to utility function U(F,S)=S+ √𝐹
5
Indifference Curve
A collection of market baskets in which consumer is indifferent
Each basket on curve generates same utility for consumer
F
I
(S,F)
Suppose 𝑈
100 index of consumer well-being
Utility measure is only in terms of order
L(20,20)
U=100 represents greater well-being than U=99 or U=50 etc.
J
S
Will indifference curve ever touch axis?
What is utility level of point L?
Why would it be impossible for L to be on the same indifference curve as J or I?
Any basket on indifference curve L is on would be preferred by consumer to any basket along 𝑈
(transitivity)
There are many combinations of F,S that can generate 𝑈
Basket F
1
S
100
J 5
⋮
20
⋮
I 20
25
5
4
As move down curve consumer substituting food for shelter
Marginal Rate of Substitution (MRS)
Represents rate at which consumer willing to substitute one good for another holding utility constant
MRS is the slope of the indifference curve
MRS
S,F
=
−∆𝐹
∆𝑆
marginal relationship changes as move down curve
6
Calculation of MRS from utility function:
As move down indifference curve, F and S are changing while utility is unchanged
Total differentiation of the utility function U(F,S) (showing effect of F and S changing)
𝜕𝑈
∙ ∆𝐹 +
𝜕𝑈
∙ ∆𝑆 = ∆𝑈
𝜕𝐹 𝜕𝑆
Along indifference curve ∆𝑈 , therefore
𝜕𝑈
∙ ∆𝐹 +
𝜕𝐹
𝑀𝑈
𝐹
𝜕𝑈
𝜕𝑆
∙ ∆𝑆 = 0 or denote partial derivatives as marginal utilities
∙ ∆𝐹 + 𝑀𝑈
𝑆
∙ ∆𝑆 = 0
Rearranging terms
𝑀𝑈
𝐹
∙ ∆𝐹 = −𝑀𝑈
−∆𝐹
=
∆𝑆
𝑀𝑈
𝑆
𝑀𝑈
𝐹
𝑆
∙ ∆𝑆
Calculate MRS for our utility function U(F,S) = F·S
F
I
MRS of 𝑈(𝐹, 𝑆) = 𝐹 ∙ 𝑆
MRS
S,F
=
𝑀𝑈
𝑆
𝑀𝑈
𝐹
=
𝐹
𝑆
Basket (S,F)
I(5,20)
J(20,5)
MRS
S,F
4
¼
J
𝑈
S
Interpretation of MRS
S,F
at points I, J?
MRS diminishes as we move down indifference curve
Marginal willingness of consumer to substitute food for shelter falls as consumer obtains more shelter and consumes less food
Examples: next course taken in quarter, next vacation in given time period
7
