CSUMB 550 Homework 6d Canonical Correlation Analysis Happy
advertisement
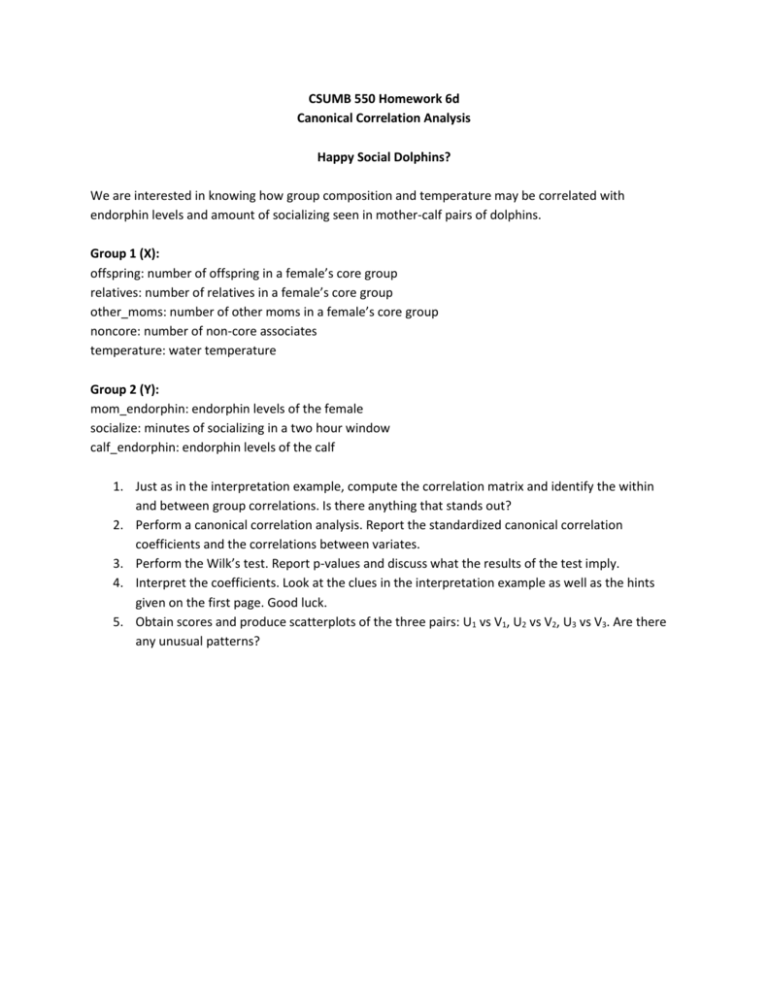
CSUMB 550 Homework 6d Canonical Correlation Analysis Happy Social Dolphins? We are interested in knowing how group composition and temperature may be correlated with endorphin levels and amount of socializing seen in mother-calf pairs of dolphins. Group 1 (X): offspring: number of offspring in a female’s core group relatives: number of relatives in a female’s core group other_moms: number of other moms in a female’s core group noncore: number of non-core associates temperature: water temperature Group 2 (Y): mom_endorphin: endorphin levels of the female socialize: minutes of socializing in a two hour window calf_endorphin: endorphin levels of the calf 1. Just as in the interpretation example, compute the correlation matrix and identify the within and between group correlations. Is there anything that stands out? 2. Perform a canonical correlation analysis. Report the standardized canonical correlation coefficients and the correlations between variates. 3. Perform the Wilk’s test. Report p-values and discuss what the results of the test imply. 4. Interpret the coefficients. Look at the clues in the interpretation example as well as the hints given on the first page. Good luck. 5. Obtain scores and produce scatterplots of the three pairs: U1 vs V1, U2 vs V2, U3 vs V3. Are there any unusual patterns?
![Anti-beta Endorphin antibody [B 31.15] ab54205 Product datasheet 2 References 1 Image](http://s2.studylib.net/store/data/011961195_1-dffebfd8ac239efaad36486e8a80c12d-300x300.png)

