Supplementary Material: DOI: 10.1515/dmdi-2015
advertisement
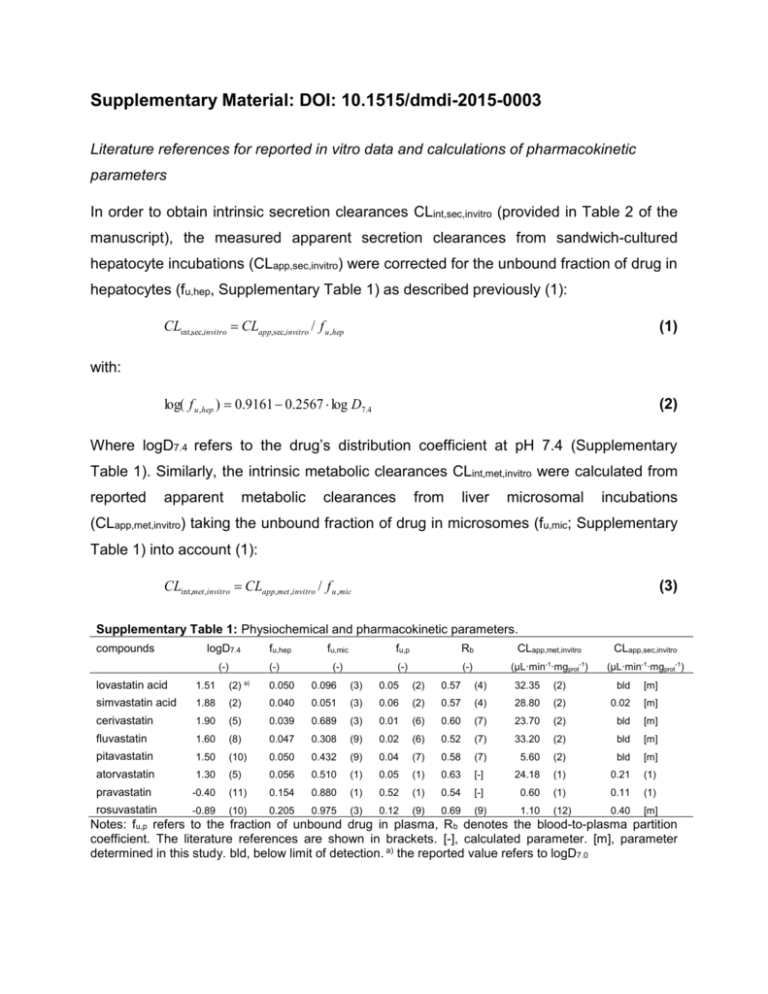
Supplementary Material: DOI: 10.1515/dmdi-2015-0003 Literature references for reported in vitro data and calculations of pharmacokinetic parameters In order to obtain intrinsic secretion clearances CLint,sec,invitro (provided in Table 2 of the manuscript), the measured apparent secretion clearances from sandwich-cultured hepatocyte incubations (CLapp,sec,invitro) were corrected for the unbound fraction of drug in hepatocytes (fu,hep, Supplementary Table 1) as described previously (1): CLint,sec,invitro CLapp,sec,invitro / f u ,hep (1) log( f u ,hep ) 0.9161 0.2567 log D7.4 (2) with: Where logD7.4 refers to the drug’s distribution coefficient at pH 7.4 (Supplementary Table 1). Similarly, the intrinsic metabolic clearances CLint,met,invitro were calculated from reported apparent metabolic clearances from liver microsomal incubations (CLapp,met,invitro) taking the unbound fraction of drug in microsomes (fu,mic; Supplementary Table 1) into account (1): CLint,met ,invitro CLapp,met ,invitro / f u ,mic (3) Supplementary Table 1: Physiochemical and pharmacokinetic parameters. compounds logD7.4 (-) fu,hep (-) fu,mic fu,p Rb CLapp,met,invitro CLapp,sec,invitro (-) (-) (-) (µL·min-1·mgprot-1) (µL·min-1·mgprot-1) lovastatin acid 1.51 (2) a) 0.050 0.096 (3) 0.05 (2) 0.57 (4) 32.35 (2) bld [m] simvastatin acid 1.88 (2) 0.040 0.051 (3) 0.06 (2) 0.57 (4) 28.80 (2) 0.02 [m] cerivastatin 1.90 (5) 0.039 0.689 (3) 0.01 (6) 0.60 (7) 23.70 (2) bld [m] fluvastatin 1.60 (8) 0.047 0.308 (9) 0.02 (6) 0.52 (7) 33.20 (2) bld [m] pitavastatin 1.50 (10) 0.050 0.432 (9) 0.04 (7) 0.58 (7) 5.60 (2) bld [m] atorvastatin 1.30 (5) 0.056 0.510 (1) 0.05 (1) 0.63 [-] 24.18 (1) 0.21 (1) pravastatin -0.40 (11) 0.154 0.880 (1) 0.52 (1) 0.54 [-] 0.60 (1) 0.11 (1) rosuvastatin -0.89 (10) 0.205 0.975 (3) 0.12 (9) 0.69 (9) 1.10 (12) 0.40 [m] Notes: fu,p refers to the fraction of unbound drug in plasma, R b denotes the blood-to-plasma partition coefficient. The literature references are shown in brackets. [-], calculated parameter. [m], parameter determined in this study. bld, below limit of detection. a) the reported value refers to logD7.0 Literature references for clinical data Supplementary Table 2 provides the literature references for all described clinical pharmacokinetic parameters. All reported clearances in Supplementary Table 2 represent plasma clearances. Hepatic clearances (CLh,obs,p) were obtained from reported total body clearances after oral (CLtot,obs,oral,p ) or i.v. (CLtot,obs,p) administration according to equations 4-6: CLtot,obs, p CLtot,obs,oral, p F (4) CLren,obs Ue CLtot,obs, p (5) CLh ,obs, p CLtot,obs, p CLren,obs, p (6) where F denotes the absolute oral bioavailability, CLren,obs,p refers to the renal organ clearance, fn,ren (= CLren,obs,p/CLtot,obs,p) refers to fraction of drug excreted unchanged in urine, and fn,h (= CLh,obs,p/CLtot,obs,p= 1- fn,ren) denotes the fractional contribution of hepatic clearance to overall clearance (Eq. 4 in main manuscript). Supplementary Table 2: Clinical data information. compounds CLtot,obs,p [mL/(min∙kg)] lovastatin acid CLh,obs,p CLren,obs,p [mL/(min∙kg)] ([mL/(min∙kg)] [mL/(min∙kg)] (13) 144.00 [-] 16.53 [-] 330.69 cerivastatin 2.04 [-] fluvastatin 3.88 [-] pitavastatin 2.02 [-] atorvastatin 3.73 [-] pravastatin 10.60 [-] rosuvastatin 11.64 (17) simvastatin acid 7.20 CLtot,obs,oral,p fn,ren fn,h (-) F (-) (-) 6.48 [-] 0.72 [-] 0.10 (2) 0.90 0.05 (2) (14) 14.39 [-] 2.15 [-] 0.13 (6) 0.87 0.05 (6) 3.40 (2) 2.04 [-] 0.00 [-] 0.00 (7) 1.00 0.60 (6) 16.17 (15) 3.65 [-] 0.23 [-] 0.06 (15) 0.94 0.24 (6) 3.97 (2) 2.02 [-] 0.00 [-] 0.00 (7) 1.00 0.51 (6) 26.62 [-] 3.69 (1) 0.04 [-] 0.01 (16) 0.99 0.14 (16) 58.89 [-] 5.62 (1) 4.98 [-] 0.47 (16) 0.53 0.18 (16) 58.20 [-] 8.40 [-] 3.24 (17) 0.28 [-] 0.72 0.20 (2) Notes: Clearance values were corrected for the average human body weight assuming 70 kg. The literature references are shown in brackets. [-], calculated parameter In the main manuscript all pharmacokinetic parameters are referring to blood, in order to compare with predicted hepatic blood clearances. Consequently, plasma-based parameters in Supplementary Table 2 were converted to the respective blood parameters by the following equation: Rb f u , p / f u ,b CLp / CLb Cb / C p (7) Where Rb (Supplementary Table 1) denotes the blood-to-plasma partition coefficient, fu,p (Supplementary Table 1) and fu,b (provided in Table 2 of the manuscript) denote the fraction of drug unbound in plasma (p) and blood (b), respectively, CLp and CLb refer to clearance values and Cp and Cb to concentrations obtained in plasma and blood, respectively. DDI predictions taking into account inhibition of renal secretion The degree of change in AUC caused by drug-drug interaction following oral (p.o.) administration can be expressed as follows: Fa Fg ,i Fh ,i D AUC po,i AUC po CLh ,i CLren,i Fa Fg Fh D (8) CLh CLren where Fa, Fg and Fh represent the fraction absorbed, fraction of drug escaping gut-wall metabolism and fraction of drug escaping hepatic extraction and D represents the administered dose. The corresponding parameters in the presence of a perpetrator drug are denoted “i”. Assuming that: (i) the substrate is not metabolized and/or transported in the intestine (Fg = 1), and (ii) Fa does not change in the presence of inhibitor, the AUC po,i/AUCpo ratio can be described as follows: AUC po,i AUC po Fh ,i (CLh CLren ) Fh (CLh ,i CLren,i ) (9) Eq. 9 was be applied for the two statins in our dataset (pravastatin, rosuvastatin), which are subject to concomitant hepatic as well as renal process inhibition by CsA. The corresponding input parameters assuming 80% process inhibition on hepatic and renal clearance and DDI anticipations are summarized in Supplementary Table 3: Supplementary Table 3: Hepatic and renal elimination contributions in clinics in absence and presence of a 80% process inhibitor. compounds CLh,obs Fh CLren,obs CLh,i,pre Fh,i CLren,i,pre AUCpo,i/ AUCpo [mL/(min∙kg)] (-) [mL/(min∙kg)] [mL/(min∙kg)] (-) [mL/(min∙kg)] (-) pravastatin 10.4 (1) 0.50 [-] 9.2 [-] 2.08 [-] 0.90 [-] 1.84 [-] 9.0 rosuvastatin 12.2 (17) 0.42 [-] 5.2 (7) 2.44 [-] 0.88 [-] 1.04 [-] 10.5 Notes: All clearance parameters represent human blood clearances. [-], calculated parameter. Assuming a 90% inhibition on both processes the data are as follows: Supplementary Table 4: Hepatic and renal elimination contributions in clinics in absence and presence of a 90% process inhibitor. compounds CLh,obs [mL/(min∙kg)] Fh (-) CLren,obs CLh,i,pre [mL/(min∙kg)] [mL/(min∙kg)] Fh,i (-) CLren,i,pre AUCpo,i/ AUCpo [mL/(min∙kg)]) (-) pravastatin 10.4 (1) 0.50 [-] 9.2 [-] 1.04 [-] 0.95 [-] 0.92 [-] 19.0 rosuvastatin 12.2 (17) 0.42 [-] 5.2 [15] 1.22 [-] 0.94 [-] 0.52 [-] 22.4 Notes: All clearance parameters represent human blood clearances. [-], calculated parameter. Supplementary references 1. Camenisch G, Umehara K. Predicting human hepatic clearance from in vitro drug metabolism and transport data: a scientific and pharmaceutical perspective for assessing drug-drug interactions. Biopharm Drug Dispos. 2012;33(4):179-94. 2. Shitara Y, Sugiyama Y. Pharmacokinetic and pharmacodynamic alterations of 3hydroxy-3-methylglutaryl coenzyme A (HMG-CoA) reductase inhibitors: drugdrug interactions and interindividual differences in transporter and metabolic enzyme functions. Pharmacol Ther. 2006;112(1):71-105. 3. Austin D, Beattie ZT, Riley T, Adami AM, Hagen CC, Hayes TL. Unobtrusive classification of sleep and wakefulness using load cells under the bed. Conf Proc IEEE Eng Med Biol Soc. 2012;2012:5254-7. 4. Gertz M, Harrison A, Houston JB, Galetin A. Prediction of human intestinal firstpass metabolism of 25 CYP3A substrates from in vitro clearance and permeability data. Drug Metab Dispos. 2010;38(7):1147-58. 5. Yabe Y, Galetin A, Houston JB. Kinetic characterization of rat hepatic uptake of 16 actively transported drugs. Drug Metab Dispos. 2011;39(10):1808-14. 6. US FDA Drug Label; Accessed via Pharmapendium database. www.accessdata.fda.gov. 2014. 7. Shitara Y, Maeda K, Ikejiri K, Yoshida K, Horie T, Sugiyama Y. Clinical significance of organic anion transporting polypeptides (OATPs) in drug disposition: their roles in hepatic clearance and intestinal absorption. Biopharm Drug Dispos. 2013;34(1):45-78. 8. Jones HM, Barton HA, Lai Y, Bi YA, Kimoto E, Kempshall S, et al. Mechanistic pharmacokinetic modeling for the prediction of transporter-mediated disposition in humans from sandwich culture human hepatocyte data. Drug Metab Dispos. 2012;40(5):1007-17. 9. Watanabe T, Kusuhara H, Maeda K, Kanamaru H, Saito Y, Hu Z, et al. Investigation of the rate-determining process in the hepatic elimination of HMGCoA reductase inhibitors in rats and humans. Drug Metab Dispos. 2010;38(2):215-22. 10. Benet LZ, Broccatelli F, Oprea TI. BDDCS applied to over 900 drugs. AAPS J. 2011;13(4):519-47. 11. Umehara K, Camenisch G. Novel in vitro-in vivo extrapolation (IVIVE) method to predict hepatic organ clearance in rat. Pharm Res. 2012;29(2):603-17. 12. Fujino H, Saito T, Tsunenari Y, Kojima J, Sakaeda T. Metabolic properties of the acid and lactone forms of HMG-CoA reductase inhibitors. Xenobiotica. 2004;34(11-12):961-71. 13. Obach RS, Lombardo F, Waters NJ. Trend analysis of a database of intravenous pharmacokinetic parameters in humans for 670 drug compounds. Drug Metab Dispos. 2008;36(7):1385-405. 14. Lilja JJ, Kivisto KT, Neuvonen PJ. Duration of effect of grapefruit juice on the pharmacokinetics of the CYP3A4 substrate simvastatin. Clin Pharmacol Ther. 2000;68(4):384-90. 15. Corsini A, Bellosta S, Baetta R, Fumagalli R, Paoletti R, Bernini F. New insights into the pharmacodynamic and pharmacokinetic properties of statins. Pharmacol Ther. 1999;84(3):413-28. 16. Kunze A, Huwyler J, Poller B, Gutmann H, Camenisch G. In vitro-in vivo extrapolation method to predict human renal clearance of drugs. J Pharm Sci. 2014;103(3):994-1001. 17. Martin PD, Warwick MJ, Dane AL, Brindley C, Short T. Absolute oral bioavailability of rosuvastatin in healthy white adult male volunteers. Clin Ther. 2003;25(10):2553-63.

