Changing co-ordinates from the Library`s catalog to a shapefile
Changing co-ordinates from Library’s catalog to ArcGIS
Changing co-ordinates from the Library’s catalog to a shapefile (polygon) in ArcGIS 10.0
Page 1 of 5
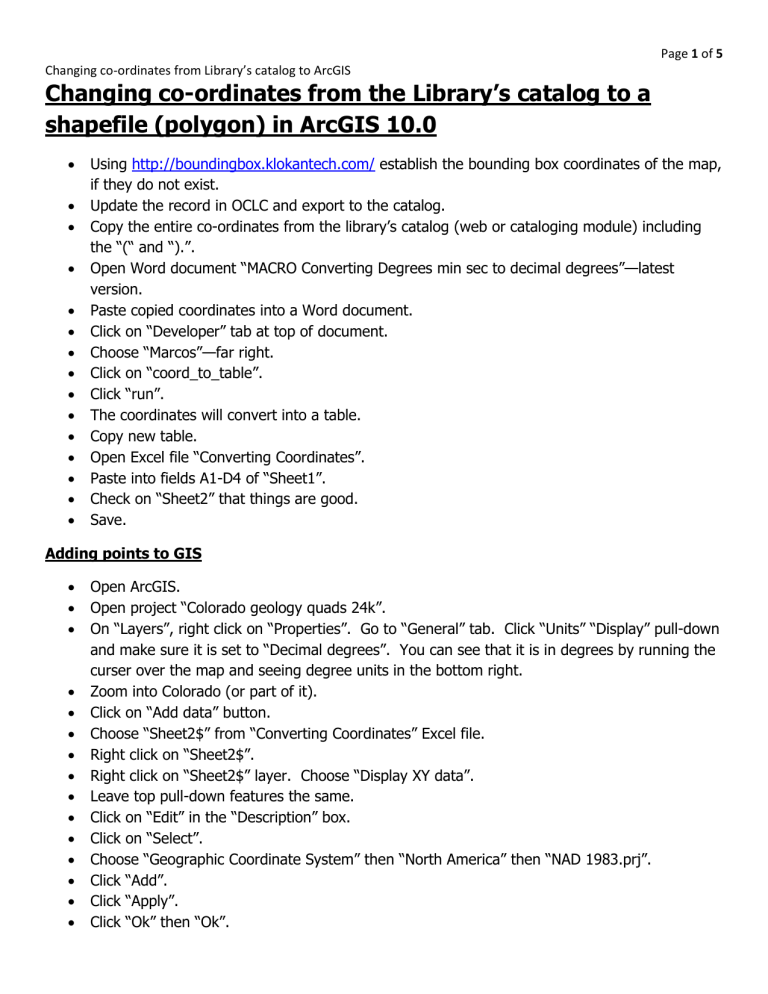
Using http://boundingbox.klokantech.com/ establish the bounding box coordinates of the map, if they do not exist.
Update the record in OCLC and export to the catalog.
Copy the entire co-ordinates from the library’s catalog (web or cataloging module) including the “(“ and “).”.
Open Word document “MACRO Converting Degrees min sec to decimal degrees”—latest version.
Paste copied coordinates into a Word document.
Click on “Developer” tab at top of document.
Choose “Marcos”—far right.
Click on “coord_to_table”.
Click “run”.
The coordinates will convert into a table.
Copy new table.
Open Excel file “Converting Coordinates”.
Paste into fields A1-D4 of “Sheet1”.
Check on “Sheet2” that things are good.
Save.
Adding points to GIS
Open ArcGIS.
Open project “Colorado geology quads 24k”.
On “Layers”, right click on “Properties”. Go to “General” tab. Click “Units” “Display” pull-down and make sure it is set to “Decimal degrees”. You can see that it is in degrees by running the curser over the map and seeing degree units in the bottom right.
Zoom into Colorado (or part of it).
Click on “Add data” button.
Choose “Sheet2$” from “Converting Coordinates” Excel file.
Right click on “Sheet2$”.
Right click on “Sheet2$” layer. Choose “Display XY data”.
Leave top pull-down features the same.
Click on “Edit” in the “Description” box.
Click on “Select”.
Choose “Geographic Coordinate System” then “North America” then “NAD 1983.prj”.
Click “Add”.
Click “Apply”.
Click “Ok” then “Ok”.
Page 2 of 5
Changing co-ordinates from Library’s catalog to ArcGIS
An error message “Table Does Not Have Object-ID Field” will pop up. Click “Ok”.
A new layer of points should appear. “Sheet2$ Events”.
The layer will be temporary. To make it permanent, you must create a new shapefile with the merged fields.
Select “Sheet2$ Events” in the Table of Contents.
Right click, select “Data” then “Export data”.
Leave “Export” set to “All features”, and “Use same coordinate system as” set to “list layer’s source data”.
In “Output feature class” choose the location of the new file, and give the new layer a name
(this will be a temp name) (e.g. g4311_c5_1944_F5_points).
Click “ok”.
When asked if you want to add the exported data to the map as a lay, click “Yes”.
Convert points to lines
We want to convert the points into lines. This takes several steps.
Open ArcToolbox (it’ll appear on the right side).
Select “Data Management Tools” then “Features” then “Points to Line”.
In “Input features” select the points layer you just created.
In “Output feature class” choose an appropriate place and name (e.g. g4311_c5_1944_F5_box).
Check the “Close Line (optional)” box.
Click “Ok”.
A new layer will appear.
SAVE
Remove (g4311_c5_1944_F5_points), “Sheet2$”, and “Sheet2$ Events” layers.
Add information about map
Right click on the new “box” layer.
Choose “Attributes table”.
From the “Table options” button (upper left corner), select “Add field”.
Name—“Subject”. Type—“Text”. Length—100.
Repeat, adding the following 5 other fields:
Name—“Scale”. Type—“Text”. Length—50.
Name—“Call_no”. Type—“Text”. Length—50.
Name—“Library_location”. Type—“Text”. Length—50.
Name—“Library_catalog”. Type—“Text”. Length—100.
Name—“Online_version”. Type—“Text”. Length—100.
Back in the “Attributes table” adjust the width of the fields so as make easy to read.
On the “Editor” tool bar (upper right), from the “Editor” pull down, choose “Start editing”.
Select the new layer (e.g. g4311_c5_1944_F5_box).
Open the “Attribute table” if not open already.
Page 3 of 5
Changing co-ordinates from Library’s catalog to ArcGIS
Enter data
In “Subject” put a subject or abbreviation of the title, plus the year (e.g. “Vanadium region of
SW Colorado and SE Utah, 1944” [note: no period at end]
In “Scale” put scale including “1:”.
In “Call_no” enter the call number.
In “Library_location” put “Map Room” or “Map Room Stacks” or “Map Room Oversize” or “Map
Room USGS Thematics Collection”. NEVER “Map Room Flat.”
In “Library_catalog” put the entire url for the record in the Library’s catalog (e.g. http://catalyst.coalliance.org/vwebv/holdingsInfo?bibId=56630).
In “Online_version” put the entire url for the scanned map or “none”.
On the “Editor” tool bar (upper right), from the “Editor” pull down, choose “Save edits”.
On the “Editor” tool bar (upper right), from the “Editor” pull down, choose “Stop editing”.
Changing output display
From the “Table of Contents”, right click on the layer and choose “Properties”.
Choose the “Display” tab.
Change “Display expression” to “Subject”.
Check the “Support hyperlinks using field” box and select “Library_catalog”.
Click on the “url” button.
Click on “Apply”.
Choose the “Symbology” tab.
Click on “Symbol”.
Choose “Highway”—this will change the width of the line to 3.4.
Change colors to the following:
Scale Color
0 -- 25k
26k – 64k
65k – 127k
128k – 257k
258k ++
Solar Yellow
Arctic White
Lapis Lazuli
Mars Red
Peridot Green
Click “Ok”.
Click on “Apply”.
Choose the “Fields” tab.
Select the “Turn all fields off” button above “Choose which fields will be visible”.
Select (put check marks next to): “Subject”, “Scale”, “Call_number”, “Library_location”,
“Library_catalog” and “Online_version”.
In the “Appearance” box to the right, change the “Alias” in each of the following fields:
Call_number Call #
Library_location Library location
Library_catalog Library catalog
Online_version Online version
Page 4 of 5
Changing co-ordinates from Library’s catalog to ArcGIS
Click “Apply”.
Choose the “HTML Popup” tab.
Select “As a formatted page based on an XSL template”.
Select “Load” then “Load XSL template”.
Choose “HTML Popup 10--colorado geology--orange yellow”.
Click on “Verify” button to confirm table colors and layout.
Click “Apply”.
Click “Ok”.
SAVE
Change attributes table order for display purposes
Select the layer in the “Table of Contents”.
Right click and select “Open attributes table”.
Adjust the columns so they are in the following order: Subject, Scale, Call #, Library location,
Library catalog, Online version
Close.
SAVE.
Export to KML file
Open ArcToolbox.
Open “Conversion Tools”.
Open “To KML”.
Double click on “Layer to KML”.
In “Layer”, choose box layer just completed.
In “Output file”, choose the appropriate location and name the file “[call number]”.
Click “Save”.
For “Layer output scale” enter “1”.
Press “Ok”.
It’ll take a moment or 2. A success box will appear in the bottom right.
Open file in Google Earth to make sure it works and looks correct.
4:30 if Excel & Arc are not open.
1.
Have in your spreadsheet x, y coordinates representing the corners in order (either clockwise or counter-clockwise but not upper left followed by lower right followed by upper right … ) and a number that corresponds to a specific map.
2.
Bring in the spreadsheet and create a point event layer using “Add X, Y”.—right click on sheet “Display xy data”
3.
Export the points to a feature class.
Page 5 of 5
Changing co-ordinates from Library’s catalog to ArcGIS
4.
Use the “Points to Line” tool under “Data Management”>”Features” in the toolbox with the attribute representing the map # in the “Line Field”
5.
The use the “Feature to Polygon” tool under the same toolbox.
That should do it. The tricky part will be having your corner x-y’s in order going around the map but the rest should be fairly straightforward I think.
(W 105°37ʹ30ʺ--W 105°30ʹ00ʺ/N 37°15ʹ00ʺ--N 37°07ʹ30ʺ).
(W 106⁰22'30"--W 106⁰15'00"/N 40⁰52'30"--N 40⁰45'00").
Stay in ArcToolbox.
Select “Data Management Tools” then “Features” then “Feature to Polygon”.
In “Input features” choose the layer you just created.
In “Output feature class” choose an appropriate place and name.
Click “ok”.
A new polygon—the footprint of the map will appear. This polygon can now be enhanced so it can be used in an appropriate way.
