Protocol - University of Leeds
advertisement
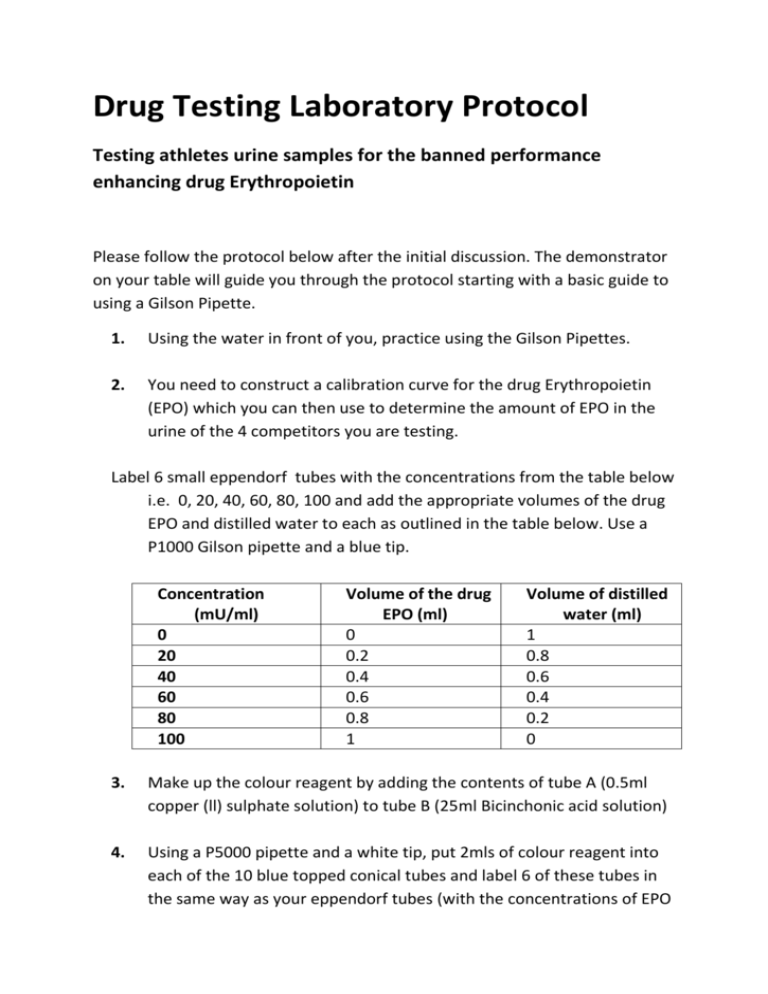
Drug Testing Laboratory Protocol Testing athletes urine samples for the banned performance enhancing drug Erythropoietin Please follow the protocol below after the initial discussion. The demonstrator on your table will guide you through the protocol starting with a basic guide to using a Gilson Pipette. 1. Using the water in front of you, practice using the Gilson Pipettes. 2. You need to construct a calibration curve for the drug Erythropoietin (EPO) which you can then use to determine the amount of EPO in the urine of the 4 competitors you are testing. Label 6 small eppendorf tubes with the concentrations from the table below i.e. 0, 20, 40, 60, 80, 100 and add the appropriate volumes of the drug EPO and distilled water to each as outlined in the table below. Use a P1000 Gilson pipette and a blue tip. Concentration (mU/ml) 0 20 40 60 80 100 Volume of the drug EPO (ml) 0 0.2 0.4 0.6 0.8 1 Volume of distilled water (ml) 1 0.8 0.6 0.4 0.2 0 3. Make up the colour reagent by adding the contents of tube A (0.5ml copper (ll) sulphate solution) to tube B (25ml Bicinchonic acid solution) 4. Using a P5000 pipette and a white tip, put 2mls of colour reagent into each of the 10 blue topped conical tubes and label 6 of these tubes in the same way as your eppendorf tubes (with the concentrations of EPO in mg/ml as per the table above). Label the other 4 with each athletes name (Tom, Abdul, Ann, Mary) as you will be testing their urine samples. TIP: Invert the tube to mix, do not shake! 5. Using a P200 pipette and a yellow tip, add 0.1ml (100 µl) of each of the solutions from your eppendorfs and 0.1ml (100µl) of the unknown solutions into the blue topped tubes containing the colour reagent. TIP: Make sure you add them into the correct tubes! 6. Replace the lids and tip the tubes gently to mix the contents- avoid shaking. 7. Put your tubes in the 37⁰C incubator for 20mins. Make a note of the time. Please listen to instructions on preparing your graphs during this incubation period. 8. At the end of the incubation period, pour the contents of each tube into a separate clean cuvette and measure the absorbance of each sample in the spectrophotometer @ 562nm. You will be shown how to do this. Concentration (mU/ml) 0 20 40 60 80 100 Tom Abdul Ann Mary Absorbance @562nm 9. Construct a calibration curve by plotting the absorbance of each of the known samples on a piece of graph paper with concentration on the x axis and absorbance on the y axis. 10. Use this graph to calculate the concentration of the drug EPO in each the four athlete’s samples. Write these in the table below. Athlete Concentration of EPO in sample Tom Abdul Ann Mary 11. Look at the results you have obtained. Who has tested positive for EPO? Are those athletes whose results suggest low values of EPO in the urine passed the test or could there be an alternative explanation? Copyright University of Leeds, D.I.Lewis and C.Haigh This work is licensed under the Creative Commons Attribution-NonCommercial 3.0 Unported License. To view a copy of this license, visit http://creativecommons.org/licenses/by-nc/3.0/ or send a letter to Creative Commons, 444 Castro Street, Suite 900, Mountain View, California, 94041, USA.
