surface - food5450groupC
advertisement

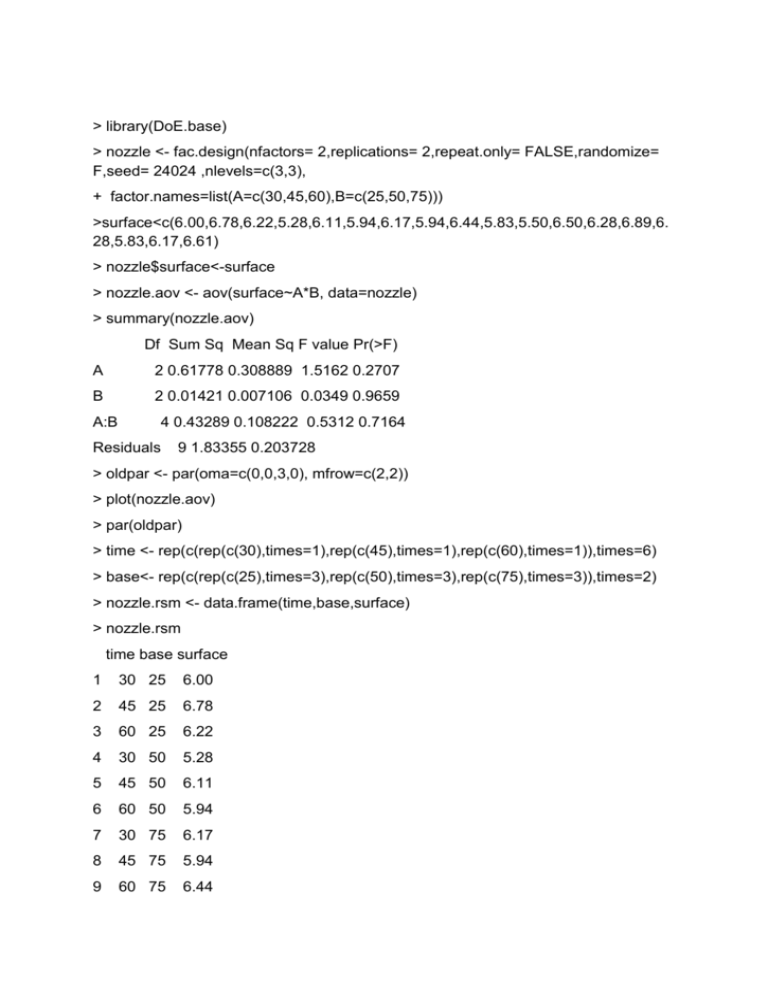
> library(DoE.base) > nozzle <- fac.design(nfactors= 2,replications= 2,repeat.only= FALSE,randomize= F,seed= 24024 ,nlevels=c(3,3), + factor.names=list(A=c(30,45,60),B=c(25,50,75))) >surface<c(6.00,6.78,6.22,5.28,6.11,5.94,6.17,5.94,6.44,5.83,5.50,6.50,6.28,6.89,6. 28,5.83,6.17,6.61) > nozzle$surface<-surface > nozzle.aov <- aov(surface~A*B, data=nozzle) > summary(nozzle.aov) Df Sum Sq Mean Sq F value Pr(>F) A 2 0.61778 0.308889 1.5162 0.2707 B 2 0.01421 0.007106 0.0349 0.9659 A:B 4 0.43289 0.108222 0.5312 0.7164 Residuals 9 1.83355 0.203728 > oldpar <- par(oma=c(0,0,3,0), mfrow=c(2,2)) > plot(nozzle.aov) > par(oldpar) > time <- rep(c(rep(c(30),times=1),rep(c(45),times=1),rep(c(60),times=1)),times=6) > base<- rep(c(rep(c(25),times=3),rep(c(50),times=3),rep(c(75),times=3)),times=2) > nozzle.rsm <- data.frame(time,base,surface) > nozzle.rsm time base surface 1 30 25 6.00 2 45 25 6.78 3 60 25 6.22 4 30 50 5.28 5 45 50 6.11 6 60 50 5.94 7 30 75 6.17 8 45 75 5.94 9 60 75 6.44 10 30 25 5.83 11 45 25 5.50 12 60 25 6.50 13 30 50 6.28 14 45 50 6.89 15 60 50 6.28 16 30 75 5.83 17 45 75 6.17 18 60 75 6.61 > library(rsm) > nozzle.CR <- coded.data(nozzle.rsm,x1~(time-45)/15,x2~(base-50)/25) > nozzle.rs<- rsm(surface ~ SO(x1,x2), data=nozzle.CR) > summary (nozzle.rs) Call: rsm(formula = surface ~ SO(x1, x2), data = nozzle.CR) Residuals: Min 1Q Median 3Q Max -0.71611 -0.10028 -0.05028 0.21514 0.68222 Coefficients: Estimate Std. Error t value Pr(>|t|) (Intercept) 6.20778 0.22889 27.121 3.89e-12 *** x1 0.21667 0.12537 1.728 0.110 x2 0.02750 0.12537 0.219 0.830 x1:x2 0.02000 0.15354 0.130 0.899 x1^2 -0.11667 0.21714 -0.537 0.601 x2^2 0.03583 0.21714 0.165 0.872 --Signif. codes: 0 ‘***’ 0.001 ‘**’ 0.01 ‘*’ 0.05 ‘.’ 0.1 ‘ ’ 1 Residual standard error: 0.4343 on 12 degrees of freedom Multiple R-squared: 0.2191, Adjusted R-squared: -0.1062 F-statistic: 0.6736 on 5 and 12 DF, p-value: 0.6514 Analysis of Variance Table Response: surface Df Sum Sq Mean Sq F value Pr(>F) FO(x1, x2) 2 0.57241 0.28620 1.5175 0.2585 TWI(x1, x2) 1 0.00320 0.00320 0.0170 0.8985 PQ(x1, x2) 2 0.05958 0.02979 0.1580 0.8556 Residuals 12 2.26324 0.18860 Lack of fit 3 0.42969 0.14323 0.7030 0.5737 Pure error 9 1.83355 0.20373 Stationary point of response surface: x1 x2 0.8747567 -0.6278391 Stationary point in original units: time base 58.12135 34.30402 Eigenanalysis: $values [1] 0.03648628 -0.11731961 $vectors [,1] [,2] [1,] -0.06515547 -0.99787513 [2,] -0.99787513 0.06515547 > library(rsm) > nozzle.CR <- coded.data(nozzle.rsm,x1~(time-45)/15,x2~(base-50)/25) > nozzle.rs<- rsm(surface ~ FO(x1,x2), data=nozzle.CR) > nozzle.rs<- rsm(surface ~ FO(x1,x2)+TWI(x1,x2), data=nozzle.CR) > summary (nozzle.rs) Call: rsm(formula = surface ~ FO(x1, x2) + TWI(x1, x2), data = nozzle.CR) Residuals: Min 1Q Median 3Q Max -0.65722 -0.11181 -0.02764 0.18819 0.73611 Coefficients: Estimate Std. Error t value Pr(>|t|) (Intercept) 6.15389 0.09601 64.098 <2e-16 *** x1 0.21667 0.11759 1.843 0.0867 . x2 0.02750 0.11759 0.234 0.8185 x1:x2 0.02000 0.14401 0.139 0.8915 --Signif. codes: 0 ‘***’ 0.001 ‘**’ 0.01 ‘*’ 0.05 ‘.’ 0.1 ‘ ’ 1 Residual standard error: 0.4073 on 14 degrees of freedom Multiple R-squared: 0.1986, Adjusted R-squared: 0.02686 F-statistic: 1.156 on 3 and 14 DF, p-value: 0.3611 Analysis of Variance Table Response: surface Df Sum Sq Mean Sq F value Pr(>F) FO(x1, x2) 2 0.57241 0.286204 1.7250 0.2140 TWI(x1, x2) 1 0.00320 0.003200 0.0193 0.8915 Residuals 14 2.32282 0.165916 Lack of fit 5 0.48927 0.097854 0.4803 0.7830 Pure error 9 1.83355 0.203728 Stationary point of response surface: x1 x2 -1.37500 -10.83333 Stationary point in original units: time base 24.3750 -220.8333 Eigenanalysis: $values [1] 0.01 -0.01 $vectors [,1] [,2] [1,] 0.7071068 -0.7071068 [2,] 0.7071068 0.7071068 > library(rsm) > nozzle.CR <- coded.data(nozzle.rsm,x1~(time-45)/15,x2~(base-50)/25) > nozzle.rs<- rsm(surface ~ FO(x1,x2), data=nozzle.CR) > summary (nozzle.rs) Call: rsm(formula = surface ~ FO(x1, x2), data = nozzle.CR) Residuals: Min 1Q Median 3Q Max -0.65722 -0.13181 -0.02764 0.19319 0.73611 Coefficients: Estimate Std. Error t value Pr(>|t|) (Intercept) 6.15389 0.09282 66.302 <2e-16 *** x1 0.21667 0.11368 1.906 0.076 . x2 0.02750 0.11368 0.242 0.812 --Signif. codes: 0 ‘***’ 0.001 ‘**’ 0.01 ‘*’ 0.05 ‘.’ 0.1 ‘ ’ 1 Residual standard error: 0.3938 on 15 degrees of freedom Multiple R-squared: 0.1975, Adjusted R-squared: 0.09049 F-statistic: 1.846 on 2 and 15 DF, p-value: 0.1920 Analysis of Variance Table Response: surface Df Sum Sq Mean Sq F value Pr(>F) FO(x1, x2) 2 0.57241 0.286204 1.8457 0.1920 Residuals 15 2.32602 0.155068 Lack of fit 6 0.49247 0.082078 0.4029 0.8596 Pure error 9 1.83355 0.203728 Direction of steepest ascent (at radius 1): x1 x2 0.9920413 0.1259129 Corresponding increment in original units: time base 14.880619 3.147823 > par(mfrow = c(1,2)) > persp(nozzle.rs, ~x1+x2,col = rainbow(50),contours = "colors",xlab=c("time(x1)", "base(x2)"),zlab = "surface", cex.lab=1.2) > contour(nozzle.rs, ~x1+x2,col = rainbow(10),xlab=c("time(x1)","base(x2)"),labcex=1.5,at=list(x3="1"))