gcb12430-sup-0001-TableS1-S2-FigS1-S3
advertisement

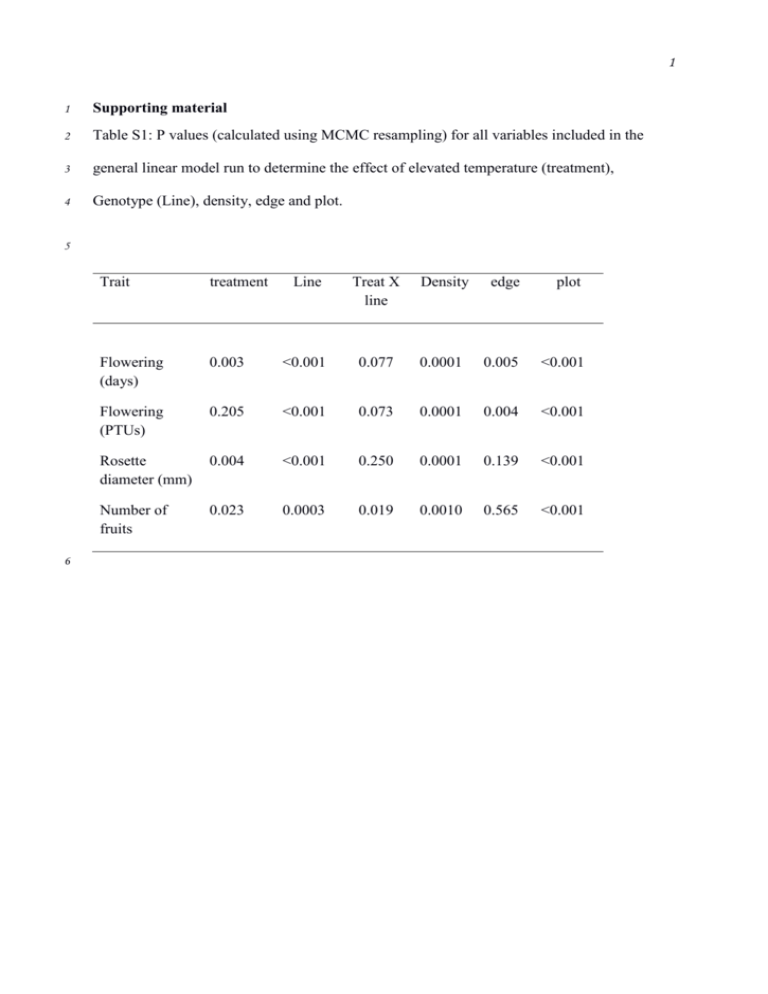
1 1 Supporting material 2 Table S1: P values (calculated using MCMC resampling) for all variables included in the 3 general linear model run to determine the effect of elevated temperature (treatment), 4 Genotype (Line), density, edge and plot. 5 6 Trait treatment Line Treat X line Density edge plot Flowering (days) 0.003 <0.001 0.077 0.0001 0.005 <0.001 Flowering (PTUs) 0.205 <0.001 0.073 0.0001 0.004 <0.001 Rosette diameter (mm) 0.004 <0.001 0.250 0.0001 0.139 <0.001 Number of fruits 0.023 0.0003 0.019 0.0010 0.565 <0.001 2 7 Table S2: List of all QTL identified for traits measured, indicating chromosomal location (Chr), position in Kb, and likelihood of QTL (logP). The estimated 8 effect of having one of the 19 possible haplotypes at each of the QTLs is also listed under the columns with the parental accessions name. Accession number 9 and more detail of each of these natural accessions available from Kover et al 2009. The largest allele effect increasing the value of the trait is underlined. The 10 allele effect that causes the smallest trait value in highlighted in bold. 11 Treatment chr Pos logP Bur Can Col Ct Edi Hi Kn Ler Mt No Oy Po Rsch Sf Tsu Wil Ws Wu Zu (Kb) Rosette diameter Elevated 1 11554 4.26 5.0 4.7 2.0 -1.4 -0.7 -4.7 -0.6 -2.2 -0.7 2.4 -2.7 1.5 5.5 -4.3 4.1 -1.4 -1.7 2.8 1.7 Elevated 5 3228 5.19 -0.2 5.7 2.9 -1.2 12.5 -3.8 -1.5 -4.1 1.1 -1.7 2.0 1.3 2.2 6.9 1.6 -0.4 3.2 -5.1 3.4 Plasticity 1 17474 3.58 13.8 16.8 10.6 12.0 11.6 6.9 14.4 11.5 15.0 14.2 10.9 15.4 19.9 10.5 22.8 7.7 17.8 16.7 12.8 Plasticity 5 626 3.62 14.8 12.3 16.4 21.5 21.2 10.1 12.6 5.2 20.6 13.5 19.1 12.8 16.4 17.2 15.1 9.1 11.9 4.9 14.5 Flowering time (days) Ambient 1 24319 6.85 -0.6 -0.4 -0.8 1.7 2.7 -1.1 -1.4 -0.1 -1.1 0.3 0.4 -0.3 -0.8 -0.6 2.9 -0.6 0.9 -0.6 -0.4 Ambient 4 1124 3.83 0.9 3.4 -1.1 0.1 1.4 -0.6 1.0 -0.7 0.9 0.2 -0.6 0.5 -0.4 2.5 0.9 -1.3 -0.6 0.8 -0.4 Ambient 5 25947 6.61 0.1 -1.5 -0.7 -1.1 0.1 -0.9 0.2 0.8 -0.2 -1.6 1.6 1.7 0.9 -0.7 0.6 -1.0 -1.3 2.2 -0.2 Elevated 1 24749 3.78 -0.6 -0.7 0.0 1.7 1.3 -1.4 -0.9 -0.5 -0.7 0.3 1.0 1.3 -0.1 -0.8 2.0 -1.2 1.2 -1.5 0.6 3 Treatment chr Pos logP Bur Can Col Ct Edi Hi Kn Ler Mt No Oy Po Rsch Sf Tsu Wil Ws Wu Zu (Kb) Elevated 1 25850 4.45 -0.4 -0.3 0.0 1.4 0.5 -1.5 -1.2 -0.5 -0.9 0.7 0.6 1.1 0.3 -0.5 1.8 -1.5 0.8 -1.3 1.1 Elevated 4 541 3.63 0.6 3.0 -0.9 -0.2 1.5 -0.6 1.7 -1.1 0.1 -0.9 0.0 0.1 -0.4 2.3 -0.4 -0.2 0.0 0.7 -0.5 Elevated 5 26012 3.85 -0.3 -1.0 -1.1 -0.3 -0.1 -1.5 0.5 0.4 -0.6 -1.8 1.1 1.1 0.6 -0.1 0.7 -0.2 -1.1 2.4 0.3 21.6 33.2 -13.9 -16.8 -2.2 -13.9 3.2 4.8 -5.3 -9.7 -6.2 36.1 -7.4 11.0 -7.6 -5.4 16.4 -8.0 -8.2 11.5 1.4 -7.7 7.8 -4.4 31.2 11.6 -15.9 -8.3 10.2 -4.1 10.2 -3.5 -19.8 19.8 20.4 10.5 -9.5 8.4 -13.2 -15.7 27.7 -1.6 13.2 3.5 -5.8 22.0 -17.1 8.7 -16.1 12.2 28.5 -4.5 -5.5 -0.6 8.6 82.1 -0.1 -46.0 -28.0 -30.3 243.0 -52.9 522.3 365.7 -131.7 367.9 29.4 53.0 509.2 16.4 Photothermal time (PTT) Ambient 1 24319 6.82 -7.2 -5.1 -9.6 Ambient 4 1124 3.78 11.7 42.9 -13.6 0.8 Ambient 5 25946 6.74 1.1 -18.0 -8.6 -12.8 0.7 -11.9 1.8 Elevated 1 25850 4.33 -3.8 -3.6 -0.3 16.8 5.7 -18.1 -13.4 -6.2 -10.4 7.8 Elevated 5 26012 3.82 12.0 47.9 -13.1 -3.1 22.5 -7.5 0.3 -10.1 -0.7 -1.3 -3.5 6.8 -17.4 26.7 25.2 -12.1 4.2 13.1 23.4 -9.9 7.0 -6.0 Fruit Number (Fitness) Ambient 1 395 3.67 -30.5 46.2 0.2 -15.4 -29.5 39.9 -10.2 4.5 Plasticity 5 1400 3.95 294.1 214.3 330.1 314.6 208.8 223.1 175.9 66.2 421.4 4 12 Figure S1: Full genome scans for QTLs for flowering time traits in control and elevated 13 temperature treatments 14 15 16 5 17 Figure S2: Full genome scans for QTLs for rosette diameter in ambient (A) and elevated (B) 18 temperature treatments. Panel C shows genome scan for QTL in plasticity in rosette diameter. 19 20 21 6 22 Figure S3: Full genome scans for QTLs for Fruit production (fitness) in ambient (A) and 23 elevated temperature (B) treatments. Panel C shows genome scan for QTL in plasticity for 24 fitness. 25 26 27 28 29