Reclaim Wasted Cooling Capacity Now Updated with CFD
Models to Support ASHRAE Case Study Data
Peer reviewed case study data from ASHRAE now updated with CFD model analysis revealing more information and visual
cues about best practice ceiling grate return and other passive cooling methods. Data validates that localized hot air leakage
and recirculation is increasing server inlet temperatures and cool air bypass is lowering AHU/CRAC return temperatures.
This paper also demonstrates how the Opengate EC system eliminates hot air recirculation and cold air bypass.
EC9005A WHITE PAPER
Geist Global
Issued January 12, 2012
Abstract
Deployment of high density equipment into data center infrastructure is now a common occurrence, yet many data centers
are not adequately equipped to handle the additional cooling requirements resulting from these deployments. This is
resulting in undesirable conditions such as recirculation or mixing of hot and cool air, poorly controlled humidity and costly
wasted cooling capacity. This paper will define; cooling over-supply, provide examples for quantifying cool air bypass and
hot air recirculation, and assign principles to evaluate high-density rack performance and cooling efficiency benefits which
are gained from Unity Cooling® - the raising of supply air temperature and supplying only the cooling required by the IT load.
Dynamics of Wasted Cooling Capacity
Region in front of the IT rack
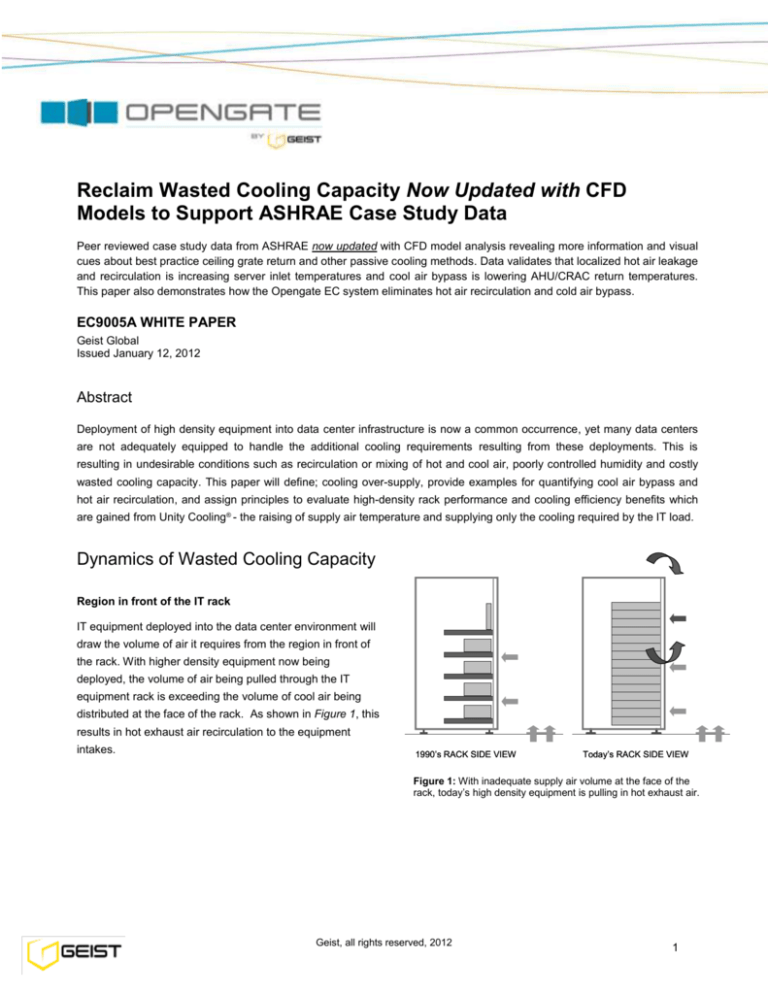
IT equipment deployed into the data center environment will
draw the volume of air it requires from the region in front of
the rack. With higher density equipment now being
deployed, the volume of air being pulled through the IT
equipment rack is exceeding the volume of cool air being
distributed at the face of the rack. As shown in Figure 1, this
results in hot exhaust air recirculation to the equipment
intakes.
1990’s RACK SIDE VIEW
Today’s RACK SIDE VIEW
Figure 1: With inadequate supply air volume at the face of the
rack, today’s high density equipment is pulling in hot exhaust air.
Geist, all rights reserved, 2012
1
Floor tile gymnastics1
Achieving desired flow rates from floor tiles, or other types of
cool air delivery methods, in front of every IT rack on the
floor is complex and highly dynamic. According to Mitch
Martin, Chief Engineer of Oracle’s Austin Data Center; “The
CFM of Tiles
excessive use of 56% open floor grates to achieve today’s
pressure. Even with CFD (computational fluid dynamics)
Figure 2: Actual tile flow rates in a medium to large data center will vary
significantly and on average be lower than expected due to many
4500
dynamic variables that are difficult to control.
4000
modeling, it is difficult to predict the effects on local floor
3500
higher required flow rates, greatly effects under floor
pressures due to adding and moving floor grates.” Figure 2
types. Variables effecting under floor pressure and the
resulting tile flow rates are; size, aspect ratio and height of
floor, positions and types of tiles, presence of floor leakage
paths, size and orientation of CRAC/H (Computer Room Air
Conditioner/Handler) units, under floor obstructions,
CRAC/H maintenance and under floor work. Given the
number of variables, it’s easy to understand why the desired
3000
Tile Flow Rate CFM
(CFM)
reveals the typical range of expected flow rates for two tile
56% Open Grate
2500
2000
1500
25% Open Perf
1000
500
0
0
0"
flow rates are not being achieved at the face of the IT
0.05
.05"
0.10
0.1"
0.20
.2"
Under Floor Pressure
(Inches
Underfloor
DP W.C.)
equipment rack. A visual representation of hot exhaust air
recirculation over the top of the racks due to insufficient
supply is shown in Figure 3 2.
Cooling over provisioning approach
A common approach to overcome cooling distribution
problems at the face of the IT rack is to overprovision the
volume of cooling and reduce the temperature of the cool air
being supplied. This cool air is being delivered below the
recommended ASHRAE low end limit to create the proper
temperatures at the top of the IT equipment rack. Due to this
unpredictable mixing of cooling overprovision with hot
exhaust air from the IT equipment, a significant portion of
cooling that is generated is never utilized, but rather is short
cycling back to the cooling units.
Figure 3: CFD model providing visual representation of hot air
recirculation to the face of the IT equipment rack due to cool air
supply instability.
1 ASHRAE Innovations in Data Center Airflow Management Seminar, Germagian, Winter Conference, January 2009
2 ASHRAE Journal Article, Designing Better Data Centers, December 2007
Geist, all rights reserved, 2012
2
Revised ASHRAE Standards for Mission Critical IT Equipment3
To provide greater operational flexibility, with emphasis on reduced energy consumption, Technical Committee (TC) 9.9
in coordination with equipment manufacturers has revised the recommended environmental specifications.
2008 Revised Equipment Environment Specifications:
Low End Temperature: 18°C (64.4 °F)
Low End Moisture: 5.5°C DP (41.9 °F)
High End Temperature: 27°C (80.6 °F)
High End Moisture: 60% RH & 15°C DP (59°F DP)
As stated by ASHRAE, the low end temperature limit should not be interpreted as a recommendation to
reduce operating temperatures as this will increase hours of chiller operation and increase energy use.
A cooling distribution strategy which allows supply air temperatures to approach the ASHRAE high end limit will improve
CRAC/H capacity, chiller plant efficiency and maximizes the hours of economizer operation.
Hot Air Leakage and Cool Air Bypass
Hot air leakage from the IT rack to the intake of the IT equipment and excess cool air bypass in the data center will limit your
ability to increase rack density, raise supply air temperature, control the environment and improve cooling efficiency. The
separation of cool supply and hot exhaust air is one step toward a cooling distribution strategy for high-density computing.
Methods that provide physical separation such as; rack heat containment, hot aisle containment and cold aisle containment
are being deployed, however without proper management, leakage and bypass is still an issue. Examples of cool air bypass
and hot air leakage associated with rack heat containment are depicted in the two figures below.4 Figure 4 illustrates the
percentage of cool air bypass for a constant hot exhaust volume flow and a particular IT equipment load. It is clear that a
lower IT equipment load for the same hot exhaust flow will create greater cool air bypass percentages. Figure 5
demonstrates hot air leakage out of the IT rack caused by high pressure in the lower and middle regions inside the rack. Not
shown are the other predictable leakage areas such as; around side panels, door frames and server mounting rails. Hot air
leakage will elevate IT intake air temperatures. Rack pressure in passive rack heat containment is highly dependent on IT
equipment airflow volume and rack air leakage passages. A tightly sealed rack having fewer air leakage pathways will create
greater rack pressure for the same flow rate. Hot and cold aisle containment exhibits similar leakage and bypass
characteristics based on aisle air leakage passages and airflow volume mismatch to and from the contained aisle.
PRESSURE (In. H2O)
0
.02
.04
PRESSURE (In. H2O)
.06 .08
-.02
45
.02 .04
.06 .08
45
35
30
25
20
15
10
69.2 ºF
69.4 ºF
40
35
69.2 ºF
U-HEIGHT
SLIGHTLY NEGATIVE PRESSURE
40
U-HEIGHT
0
HIGH POSITIVE PRESSURE
-.02
30
25
20
15
71.6 ºF
5
10
5
RACK PRESSURE
RACK SIDE VIEW
76.0 ºF
83.6 ºF
RACK PRESSURE
Figure 4: Active rack fan releasing 1640 CFM to ceiling plenum for
1400 CFM load represents 240 CFM (17%) cool air bypass.
71.8 ºF
RACK SIDE VIEW
Figure 5: Passive rack releasing 1040 CFM to ceiling plenum
for 1400 CFM load represents 360 CFM (26%) hot air leakage.
3 2008 ASHRAE Environmental Guidelines for Datacom Equipment -Expanding the Recommended Environmental Envelope
4 ASHRAE High Density Data Center Best Practices and Case Studies book, November 2007
Geist, all rights reserved, 2012
3
Hot air leakage and cool air bypass when using a ceiling plenum return
A ceiling plenum provides viable physical separation of cool supply air from hot return air. Using return grates in the ceiling
for the hot air to penetrate will compromise the physical separation and allow hot air leakage in the center of the room
furthest from the CRAC/H returns and cool air bypass in the regions closer to the CRAC/H returns. Relying on negative
pressure in the ceiling plenum to pull air through a ceiling grate or rack heat containment exhaust duct is highly dependent
on; room size, ceiling plenum size, size and distance between CRAC/H returns and rack exhaust air flow rates.
In ceiling regions closest to the CRAC/H return slight negative pressures can develop, helping to remove some rack
pressure created by the IT fans in the rack; however, pressure in the middle and bottom of the rack is likely to remain
positive and thus create additional work for the IT equipment fans and additional hot air leakage paths.
Hot air leakage can be exacerbated in racks that are farthest away from the CRAC/H returns. In these regions, slight
positive pressures can develop in the ceiling plenum due to multiple racks’ exhaust flows and low return flows generated by
the CRAC/H units. With a fan assisted rack exhaust duct, moving the same or more flow than the IT equipment in the rack, a
positive ceiling pressure will have no measurable effect on rack hot air leakage and will provide a good rack plenum
environment for IT equipment fans to do their job.
Leakage and bypass in a mixed system
Plan View
The CFD model of Figure 6 represents a mixed
system with 70% of the IT racks having
managed rack heat containment and the
remainder of the IT racks with only return
Full Temp Scale
grates in the ceiling over the hot exhaust
95 ºF
areas. This mixed system of rack heat
68 ºF
CRAC/H Return
containment and ceiling return grates
demonstrates a stable IT environment when
supplying 20% more cooling than is required
Ducted Return
Elevation View
Ceiling Grate Return
by the IT equipment. As can be seen in Figure
6, the predictable bypass passages for the
majority of the additional 20% cool air being
supplied are the ceiling return grates. Also
visible in Figure 6 is the lower return
temperature to the CRAC/H units closest to the
ceiling grates due to the cool air bypass. A
Figure 6: A mixed system of managed rack heat containment and ceiling return
managed cooling distribution solution should
grates demonstrates necessary cooling over-supply due to cool air bypass
aim to eliminate leakage and bypass while
through ceiling return grates.
providing tools to report the actual cooling
being demanded by the IT equipment. Further,
dynamic controls to maintain a 1:1 cooling
supply to IT demand relationship should be
considered in the overall solution to maximize
cooling efficiency.
Geist, all rights reserved, 2012
4
Updated Analysis: CFD Modeling Project Compares Ceiling Grate Return to
Opengate EC for a Single Suite within the Larger Facility
Computational Fluid Dynamics Modeling
Parameters
• Compare two models; 1) Ceiling grate
return and 2) Opengate Containment
Cooling in one of the four suites
• All models have the same raised floor,
room envelope and ceiling plenum
vertical height.
• Perimeter AC units will be run at 88%
of total airflow and temperature
delivery constant.
• Perforated floor tiles in cold aisles and
ceiling grates in hot aisles
• Each individual suite total IT load will
be evenly distributed across the
number of racks in that suite.
Data Center Shell
• Facility of 5,429 sq.-ft.
• Overall Height 149in.
• 18in. Raised Floor
• 29in. Dropped Ceiling
Rack Power Load Distribution for Suite
Data Center Loading and Cooling
• 620 kW of IT Load
• PDU dissipation set to 3% of IT power
output
• UPS heat dissipation set to 22 kW
each
• 26 Ton Perimeter Cooling units (qty.
11) set to 88% of full capacity airflow
(7,920 CFM) each
• Cooling unit returns are ducted to the
ceiling plenum
• Supply air temperature fixed at 58F
and supply air volume for each 26T
CRAC at 7,920 CFM.
• 120 CFM per kW (industry accepted
average) will be used to determine IT
air volume flow rates.
• Server load evenly distributed within
rack from 1U to 38U
• Typical rack gaps and leakage
modeled
• Racks have solid back doors and
cabinets without EC20 units have
sides opened to the adjacent EC20
cabinets
3D Model of Suite Being Evaluated Within Larger
Facility
Cooling Unit and Rack Load
26 Ton Cooling Unit with Return
Duct Extension and Sub-floor Plug
Fans
Geist, all rights reserved, 2012
Opengate EC
Supporting Rack
Load
5
CFD Plots Comparing Ceiling Grate to Opengate EC at 20U and 30U Rack Positions
`
CFD Modeling Conclusions: Ceiling Grate versus Opengate EC
• CFD modeling data correlates with empirical data and proves to be a good tool to compare
between the two designs.
• Ceiling grate return does not address cool air bypass. Cool air is returned to the cooling
units unused and when more cool air is generated to compensate, cool air bypass
increases further.
• Opengate EC20 in suite eliminates cool air bypass, leaving more cooling for the IT load in
the other suites.
• To take advantage of the cooling waste reduction in suite, supply volume can be reduced
from the AC units and by eliminating some floor tiles. This will result in more air for other
suites in the facility.
• At full data center loading and with Opengate EC in suite, no hot spots and better stability
of rack intake temperatures was achieved.
• When Opengate is deployed in remaining suites supply air temperature can be raised from
58 to 68 Degrees Fahrenheit allowing maximum hours of free cooling.
Geist, all rights reserved, 2012
6
Updated Analysis: CFD Modeling Compares Passive Rack Chimney (Metal
Extension Duct at Top of Rack) to Opengate EC
Rack-Based Heat Containment
With rack-based heat containment the flow rate exhausting out the rack top chimney must closely match the server
flow rates to prevent localized hot air leakage and cool air bypass. The following diagram comparing flow rate
matching for Helper Fan and Passive is courtesy of ASHRAE from the Case Study Book on High Density Data
Center Best Practices. Also included for comparison is the Opengate EC with Server exhaust airflow matching.
ASHRAE CFD Study: Standard Racks with Perforated Front and Rear Doors
– Where are the localized hot air Leaks?
Rack loads of 5, 10, 15 and 20 kW showing hot air leakage at rack front rails and rack front bottom. 20% of hot air leakage
for 5 kW rack load and a big jump to 37% hot air leakage for a 10 kW rack load. Rack construction and daily maintenance
on the IT floor creates many paths for heat to recirculate back to the IT equipment intakes: Around servers, between
servers, through idle servers and through gaps in metal racks. The following diagrams are courtesy of ASHRAE Journal
Article; Rack Enclosures, A Crucial Link in Airflow Management in Data Centers. Kishor Khankari, Ph.D., Member ASHRAE.
Geist, all rights reserved, 2012
7
ASHRAE CFD Study: Attempts to Seal the Server Rack to Prevent Localized Hot Air
Leakage is Driving Rack Pressure Higher
Server manufacturers will not warranty servers placed in operating environments they have not been designed for. High
positive pressure in the area behind the server exhaust is causing restricted flow through servers and/or increased server
fan speed to compensate. The following diagram, also courtesy of ASHRAE, shows rack pressure increase with leakage
paths blocked for the four different rack loads. These pressures are for racks with perforated front and rear doors. Racks
with passive chimneys having solid rear doors and no helper fan would have even greater pressure behind the server.
CFD Model Demonstrates Localized Hot Air Leakage.
With pressure in rack created by server exhaust and the typical restricted flow from a 2 FT x 2 FT passive chimney; server
intake temperatures are 10 to 16°F greater than the data center supply air temperature.
Server Inlet Temperature Distribution
Localized leakage of hot server air requires cooling
to the worst hot spot in the data center, hampering
plans to save energy on cooling. These localized hot
spots also prevent additional server deployment.
Based on this model, the supply temperature would
need to be reduced and additional cool air volume
would need to be increased.
86F Inlet
Temp
Ceiling Plenum Pressure Plot
With 12% oversupply, the ceiling pressure above
the racks is slightly negative. Larger amounts of
oversupply would be needed to create a greater
negative pressure in the ceiling. This ceiling
pressure is considerably lower pressure than the
area behind the servers. Based on this, the
pressure behind the servers and the resulting hot
air leakage will remain. Servers in passive
chimney racks will be working harder due to high
rack pressures.
Actual ceiling pressure would be lower due to
leakage in the typical ceiling plenum construction
that is not modeled in CFD. Ceiling pressure
distribution variation in this model highlights the
requirement for active rack heat containment.
70F
Supply
Air Temp
- 0.0009
- 0.0013
- 0.0016
- 0.0019
Geist, all rights reserved, 2012
- 0.0022
8
Updated Material: Department of Energy DCEP Training Slide
Containment Cooling Should Aim to Contain 100% of the Server Hot Air and
Prevent Cool Air Bypass
The following provided by Geist Global represents 100% heat containment at the source (server) with room temperature
essentially the same as the supply air temperature. With this method, the option to supply cooling dynamically to match the
IT load changes is possible since no hot air is recirculating. Air delivery options such as; vertical overhead supply, through
wall or upflow perimeter units are possible for raised floor or slab floor.
Stranded Cooling Capacity Efficiency Consideration
CRAC/H fan and server fan performance efficiency consideration 5
Data center wide fan power efficiency must be evaluated when choosing a cooling strategy. It is important to note that fan
power and airflow do not have a linear relationship. The cubic fan power law has a significant effect on fan power
consumption. For example; with a fan delivering 50% of the rated airflow capacity, the power consumption of the fan is
slightly more than 10% of its full rated power. Speed controlled CRAC/H fans to eliminate overprovision has a greater effect
on energy efficiency improvements than just turning off over provisioned CRAC/H units. Server fans consuming less air,
resulting in higher exhaust temperatures for the same intake air temperature, will provide efficiency gains that cascade
across the entire power and cooling infrastructure. A cooling strategy allowing deployment of high delta-T servers is critical.
Lost opportunity cost – unrealized capacity
Reclaiming stranded cooling will have a significant effect on maximizing the life of existing data centers. When oversupplying cooling, the impact to business is a realized load that is significantly less than the design load. Excess airflow, low
CRAC/H capacity due to low supply/return temperatures, and low chiller plant efficiency and hours of economizer operation
all contribute to unrealized capacity. As illustrated in Figure 7, the inefficiency of cooling over-supply could mean as much as
1.2 megawatts of stranded or lost capacity for a 2 megawatt design. As illustrated in Figure 8, a 2 megawatt design partially
loaded to 1 megawatt would waste 30% of the CRAC/H fan power with 50% cooling over-supply.
5 Oracle Heat Containment Presentation at PIAC Conference, Data Center Conservation Workshop, IBM, August 2007
Geist, all rights reserved, 2012
9
1200
At 50% cooling over-supply for a 2 megawatt
250 kW
Design Load Curves
500 kW
1000
750 kW
Lost Capacity (kW)
design load, the green curve in Figure 8
illustrates that only 1.3 megawatts of data
center capacity is realized at full CRAC fan
power. With CRAC fans controlled to 40% of
full rated power, the realized capacity is 1
800
1000 kW
1500 kW
600
2000 kW
400
megawatt. Alternatively, if we eliminate
200
cooling over-supply as illustrated by the dark
0
blue curve of Figure 8, CRAC fans would
0
25
50
only need to run at 12% of their full rated
75
100
125
power to realize 1 megawatt of data center
load. Using this example, cooling fans
Figure 7: Impact of data center design load and over-supply
percent on realized data center capacity
consuming 20 kW to properly provision the 1
100
megawatt part load, would consume 68 kW
% of Maximum Fan Power
in the 50% over-supplied data center and
consume 160 kW in the 100% over-supplied
data center.
Additional lost opportunity cost factors to
consider in such an analysis would include:
the ability to maximize rack and row density
to gain maximum use of existing real estate,
Uptime
Over-Supply Percent Curves
80
60
0%
25%
50%
40
75%
100%
20
continued use of cost effective and large air
125%
Unity Cooling
handlers or perimeter cooling, reduced
150%
0
installation and service costs, reduced user
250
500
750
interaction with floor tile gymnastics and
1000
1250
1500
1750
Partial Data Center Loading (kW)
greater availability - achievable with a data
Figure 8: Impact of over-supply percent and partial data center loading on
percent of maximum fan power for CRAC/H having adjustable flow rates
center free of hot air recirculation.
CRAC/H and chiller efficiency considerations6
A CRAC/H unit deployed in a system allowing a higher supply and return temperature will operate at greater efficiency.
Table 1 data supplied by a CRAC/H manufacturer demonstrates this cooling capacity increase. Referring to Table 1, the top
line is fairly close to a conventionally cooled data center with return temperature controls. With supply air conditions well
outside of the ASHRAE Class 1 standard, the sensible cooling of 107 kW is quite a bit lower than the total cooling of 128
kW. The CRAC is also capable of increased capacity as the return air temp is elevated. With the return dry bulb air at 100
ºF, the CRAC capacity almost doubles.
Table 1: 45 ºF entering chilled water temperature with control valve full open
Return Dry Bulb (ºF) % Rh
150
Over-Supply %
Leaving Fluid Temp (ºF)
Total Cooling (kW)
Sensible Cooling (kW)
Sensible Ratio (SHR)
Supply Dry Bulb (ºF)
72
50.0
58.5
128
107
83%
51.1
80
38.3
62.0
164
144
88%
51.4
90
27.8
66.5
210
188
90%
52.1
100
20.4
71.0
255
228
89%
53.2
6 Oracle Heat Containment Presentation, PIAC Conference, Data Center Conservation Workshop, IBM, August 2007
Geist, all rights reserved, 2012
10
2000
Table 2 data demonstrates maintaining a 68 ºF supply dry bulb to increase total cooling and improve the sensible heat ratio
(SHR) to allow even greater sensible cooling. Data indicates that the CRAC requires a lower cooling water flow rate and this
performance indicates it might be most efficient to dial back some cooling capacity and let the chillers run at their most
efficient operating parameters. Greater temperature differential from chilled water and return air improves coil performance.
Table 2: 45 ºF entering chilled water temperature with control valve throttled
Return Dry Bulb (ºF)
% Rh
Leaving Water (ºF)
Total Cooling (kW)
Sensible Cooling (kW)
Sensible Ratio (SHR)
Supply Dry Bulb (ºF)
80
38.3
76.0
204
192
94%
68.2
90
27.8
85.2
371
355
96%
68.3
100
20.4
93.1
545
516
95%
68.1
Manufacturer’s data demonstrate that chillers run more efficiently and give additional capacity if the chilled water
temperature is raised. By raising the entering chilled water temperature from 45 to 50 ºF a R134-A high-pressure chiller
realizes a 9% capacity increase and a 6% energy savings and a R123 low pressure VFD chiller realizes a 17% capacity
increase and a 12% energy savings. Increasing chilled water temperature will also provide increased hours for available
water-side economizer operation, to the point where it becomes economically feasible even in warmer climates. Raising the
supply air temperature to 70 ºF would require approximately 55 ºF chiller condenser water. In comparison, a 59 ºF supply air
temperature would require approximately a 45 ºF condenser water temperature. With a 5 ºF approach temperature, waterside economizers could be utilized at outdoor air temperatures up to 50 ºF for a 70 ºF supply versus outdoor air
temperatures up to 40 ºF if supply air is left at 59 ºF.
Conclusions
Reclaiming wasted cooling capacity which results from hot air leakage and cool air bypass is possible with an intelligently
managed cooling distribution system. Physical barriers to separate cool supply from hot return air without proper
management techniques is likely to create issues for IT equipment operation, allow too much leakage or bypass air from
racks or contained aisles and hamper environment stability and energy saving efforts. Real-time reporting of actual rack
airflow consumption supports the elimination of cooling over-supply when the rack airflow consumption data stream is
aggregated across the entire data center and used to automatically or manually turn CRAC/H units on or off, or is utilized as
input to control CRAC or air handler fans. The ability to more closely match the cooling supply volume to the IT consumption
provides one of the greatest cooling efficiency improvements available; however free water side economizer cooling offers
additional benefits even in warmer climates. When a managed cooling distribution strategy is utilized, the greatest savings is
likely to come from your ability to maximize data center real estate and other resources by maximizing rack and floor density
while using existing or familiar cooling systems, such as perimeter cooling or air handlers. This is particularly useful for
maximizing energy efficiency as the data center floor is only partly loaded; the greater savings is recouped earlier in the life
of the data center. Finally, an intelligently managed system, by definition, can provide real-time reporting, alarm notification,
capacity assessment and planning for the data center operator and individual customers in a colocation environment.
Geist, all rights reserved, 2012
11
About the Author: Mark Germagian oversees Geist’s new product development with the responsibility to lead the firm
into new technology areas relating to effective and efficient data center operation. Prior to Geist, Mark evolved
intelligent containment technology and started Opengate Data Systems where he directed technology development,
producing innovative power and cooling products for telecom and information technology environments. Mark is a
contributing author for ASHRAE TC9.9 datacom series publications and holds multiple U.S. and international patents
for power and cooling systems.
Geist
Geist designs and manufactures industry leading technology and software for powering, cooling and managing critical
data center infrastructure. We produce affordable, quality products while providing our clients with superior service.
Whether it’s enhancing customer care services or implementing new technologies, Geist promotes innovation, quality,
and satisfaction in all aspects of business. www.geistglobal.com
Geist, all rights reserved, 2012
12

